for developers
We connect your favorite coding agent to prod to fix application
bugs automatically. Run us locally and eliminate PR slop.
One copy/paste in your terminal, and you're done.
npm install -g @multiplayer-app/cli && multiplayer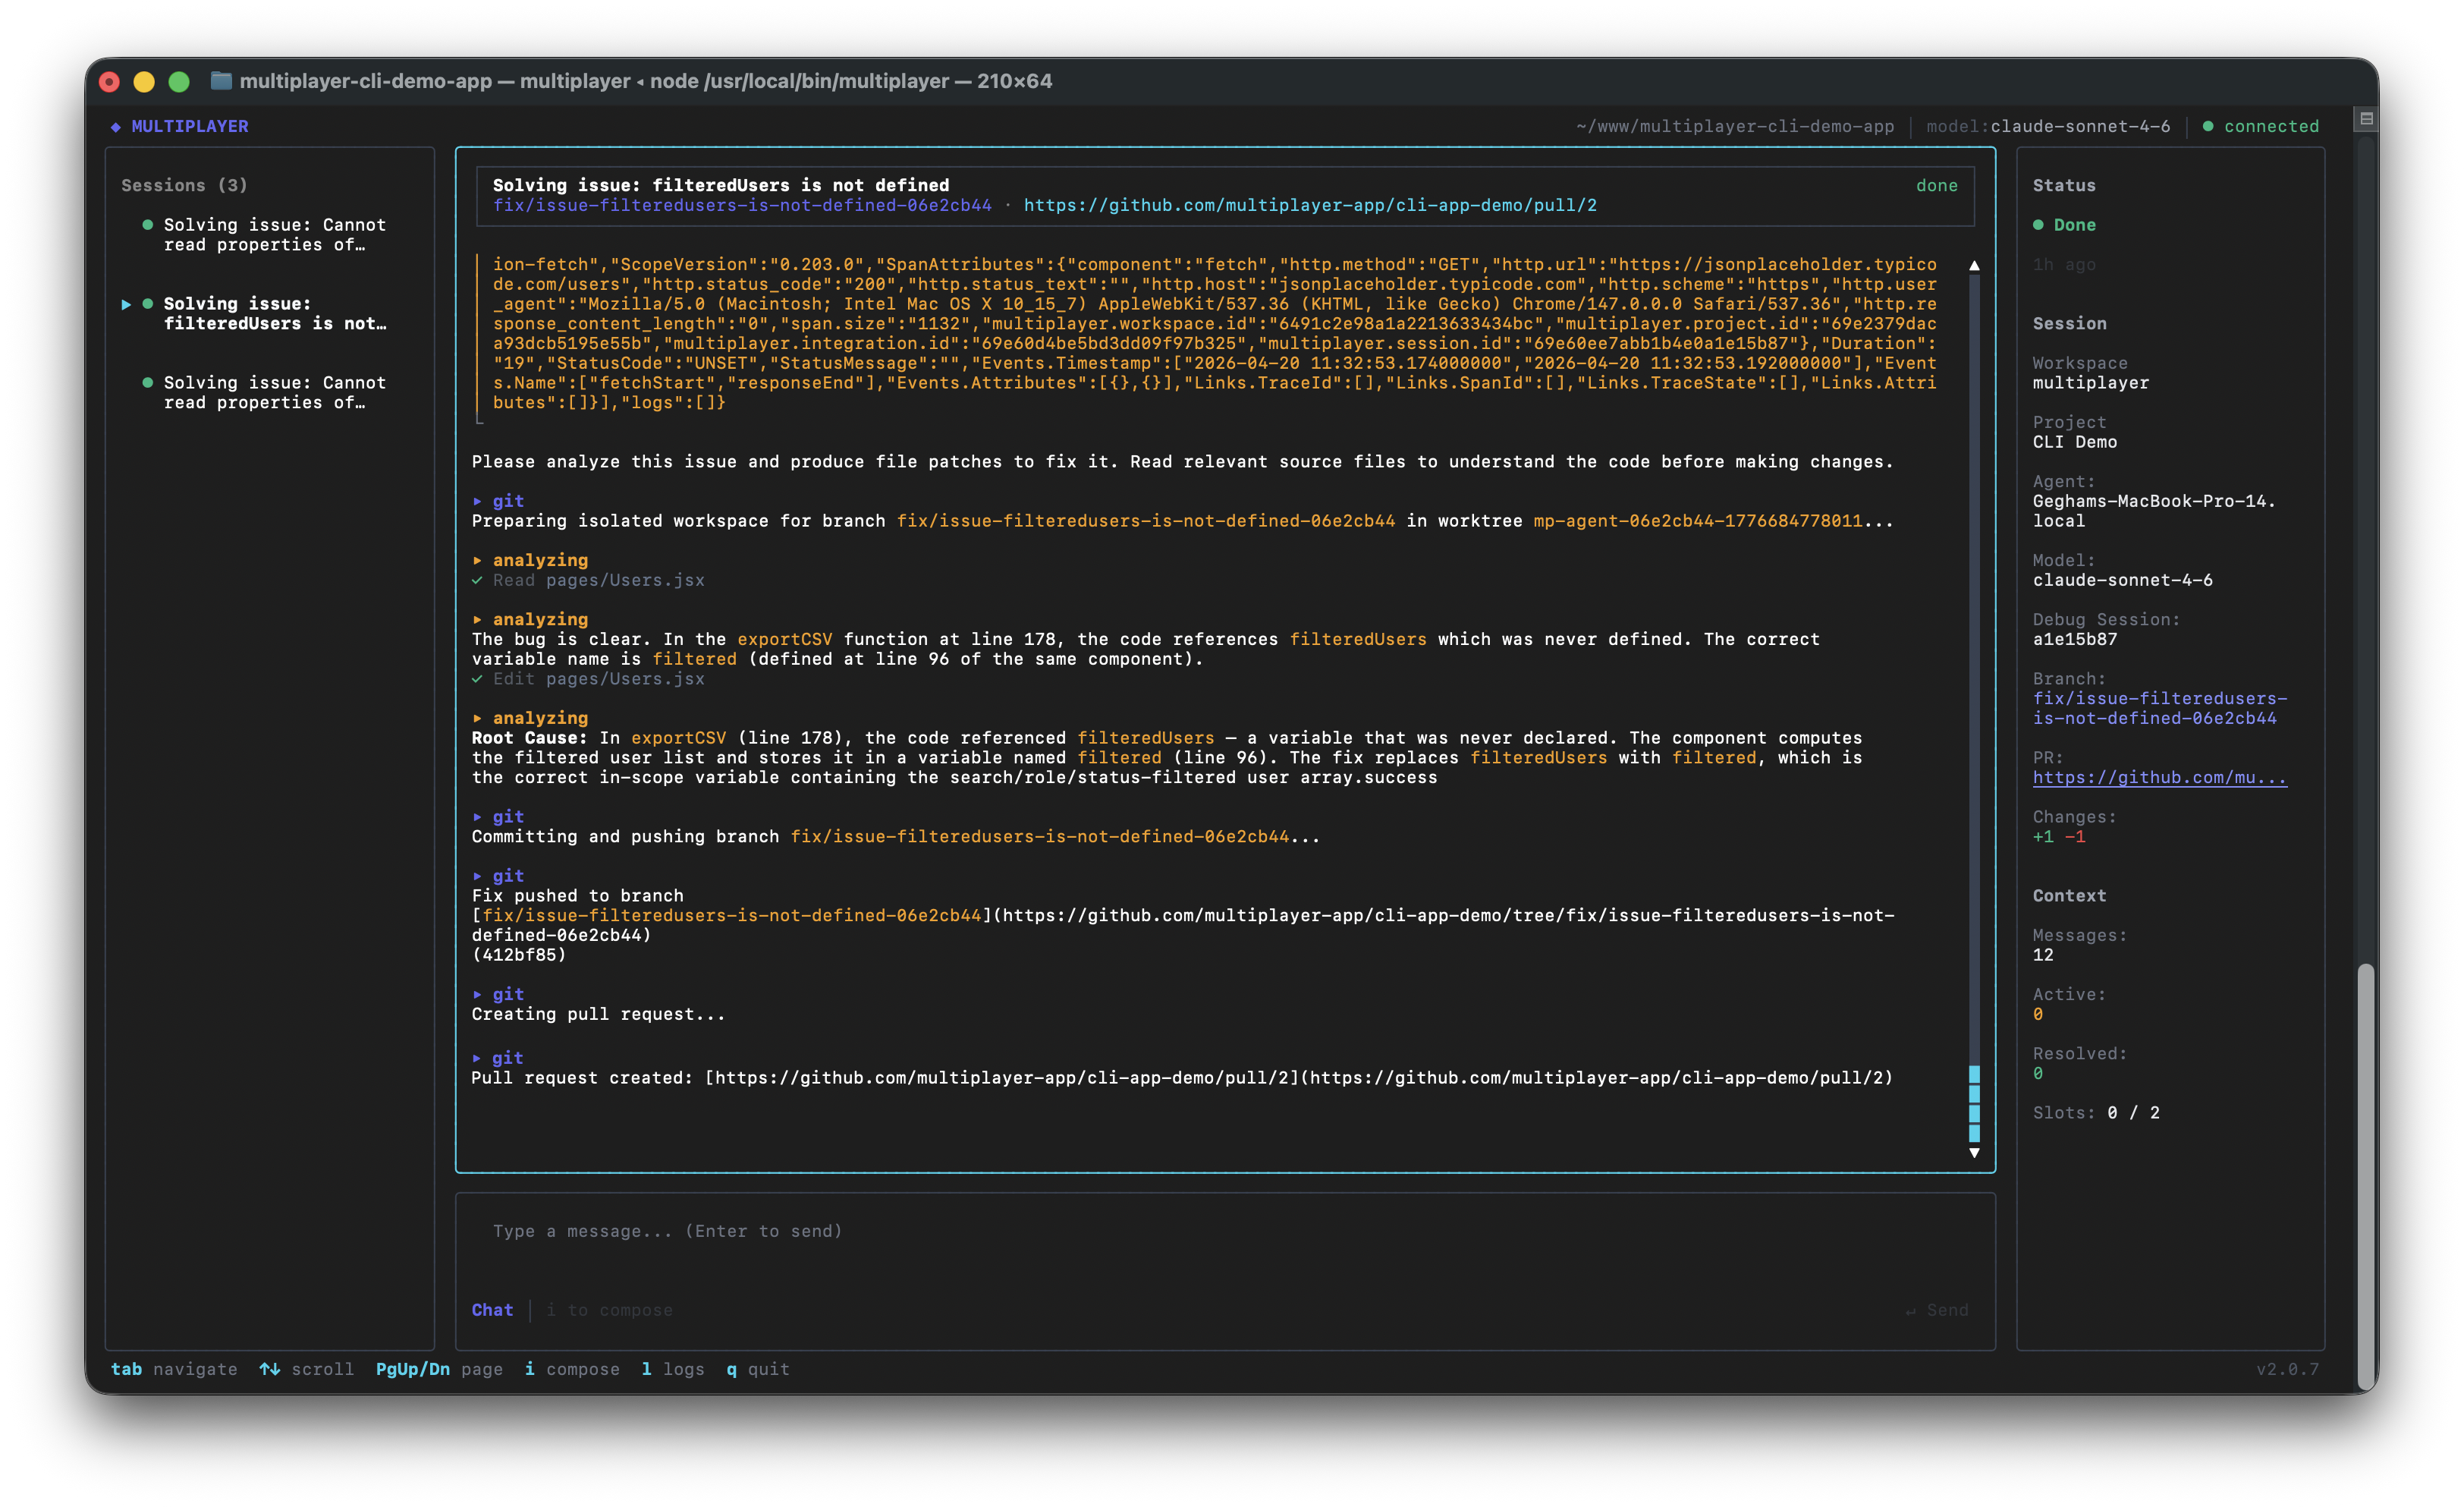
LOVED BY ENGINEERING TEAMS FROM STARTUPS TO ENTERPRISES


Four reasons why you should debug
with Multiplayer:
Better data for AI agents (and humans)
Full-stack, auto-correlated, unsampled.
Everything you need from frontend screens to backend traces and logs. We also include things your observability tools miss like request/response content and headers from all components in your system.
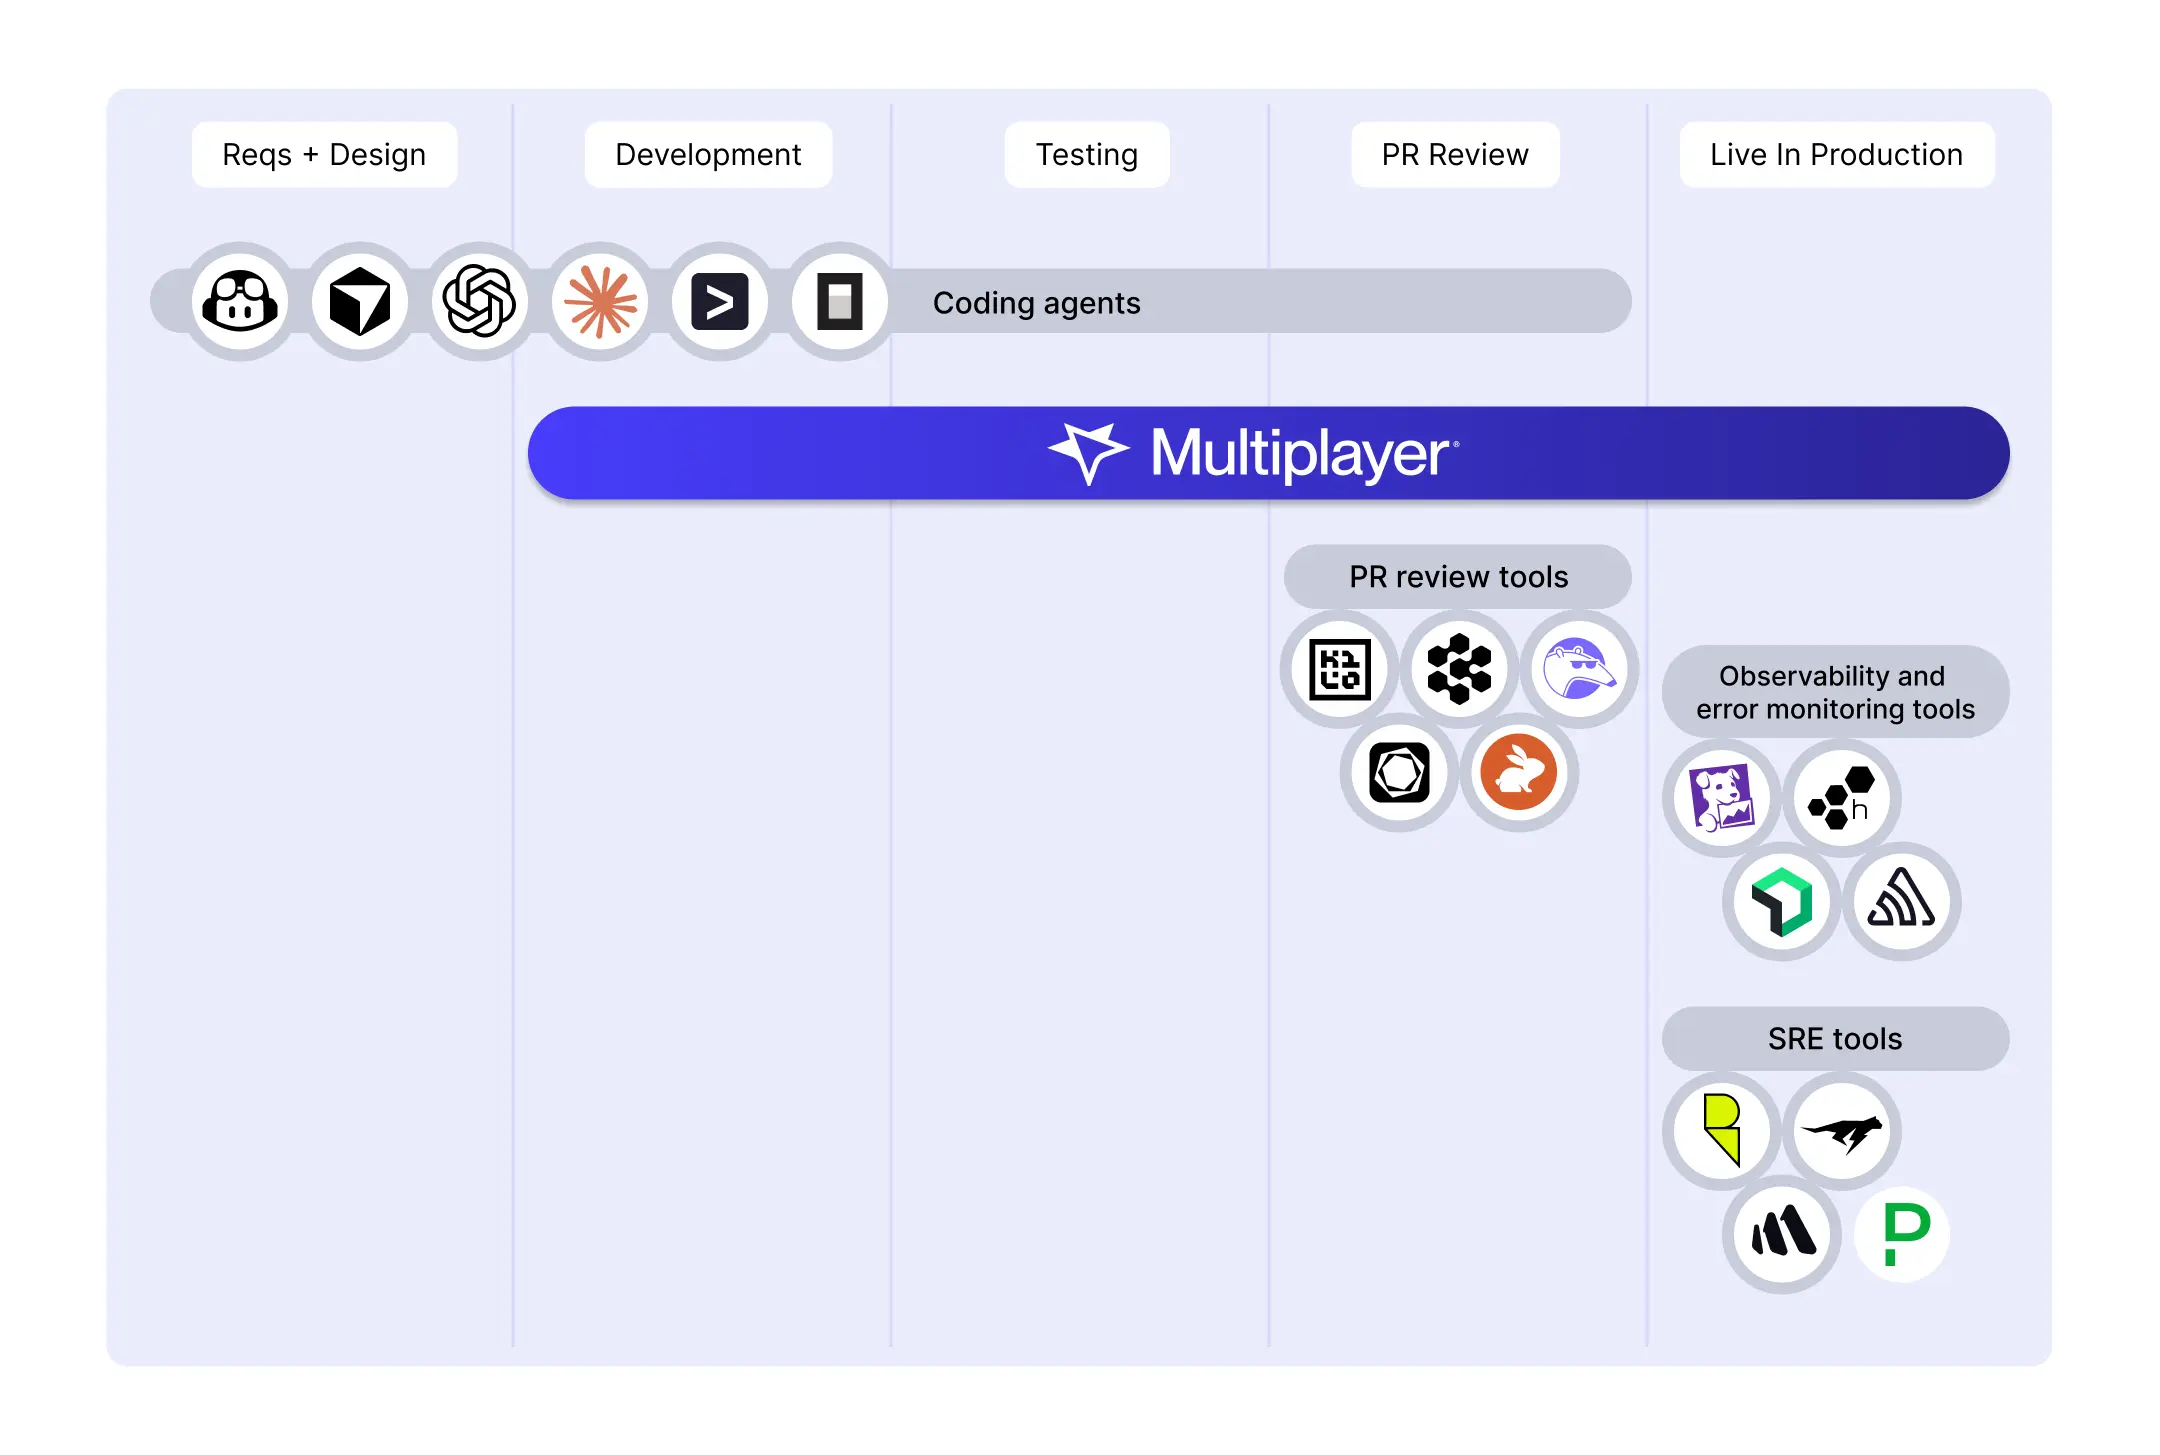
Plug & Play with your favorite coding agent
Claude Code, Codex, Copilot, …
Route issues directly to any and all coding agents you already use and love.
Local first, more secure
Run it locally and send only the data you want.
Run Multiplayer right next to your coding agent. We cache sessions locally and send data only when we identify a new issue.
Intelligent issue creation and deduplication
No PR slop or review fatigue.
We gather only the data you need and just enough of it. Issues are deduplicated so the same bug is only tracked once, no matter how many times it was reported. You never have to review or fix the same issue twice.
How Multiplayer works:


But, I already debug with …
… Claude Code
(or any other coding agent)
Claude is a great coding agent, but it’s not connected to your system in production. Use Multiplayer to connect Claude to prod. We gather all the data you need to fix bugs and give it to Claude (or whatever coding agent you like to use) so you get high-quality PRs fast.
… Sentry Seer
(or any other debugging agent from an error monitoring tool)
Seer works well for error logging but take a look at your Sentry dashboard and imagine a PR for every issue you see. Add the problem of missing or sampled out data and all you get is PR slop. And with their Claude Code integration, you get plausible-looking fixes based on missing data that fail in production. And, you continue to rack up costs with every session. Multiplayer runs locally to give you a handful of high-quality PRs instead of an avalanche of noisy ones.
… Datadog Bits AI
(or any observability-based AI agent)
Bits AI is a great SRE agent for DevOps but it’s not a tool for developers. If you’re using observability tools for debugging you already know you have to save all the data just in case you need it to fix a bug. This gets very expensive. Multiplayer captures a short time window of data around an issue: only the data needed to fix the issue, nothing more.
… Resolve
(or any other SRE AI agent)
Resolve is a great tool for DevOps but it’s not for developers. It suffers from the same limitations as the observability tools it connects to: it doesn’t have the right data. It either has too much or it’s missing the specific data needed to fix application bugs. Multiplayer captures a short time window of data around an issue: only the data needed to fix the issue, nothing more.
… CodeRabbit
(or any other PR review tool)
CodeRabbit is a great code review platform. It uses static analysis and needs access to your code base. Multiplayer is upstream from this. We are a debugging companion that runs next to your coding agent so you can fix application bugs whenever they happen, during runtime.
… my brain
(or any other "manual" way)
And you’ll continue to! But the volume and speed at which coding agents generate code is genuinely difficult to keep up with on raw cognitive horsepower alone. So why not save your brain for the work only you can do: figuring out what to build, debating architectural trade-offs, and having strong opinions about what features to add to the roadmap?
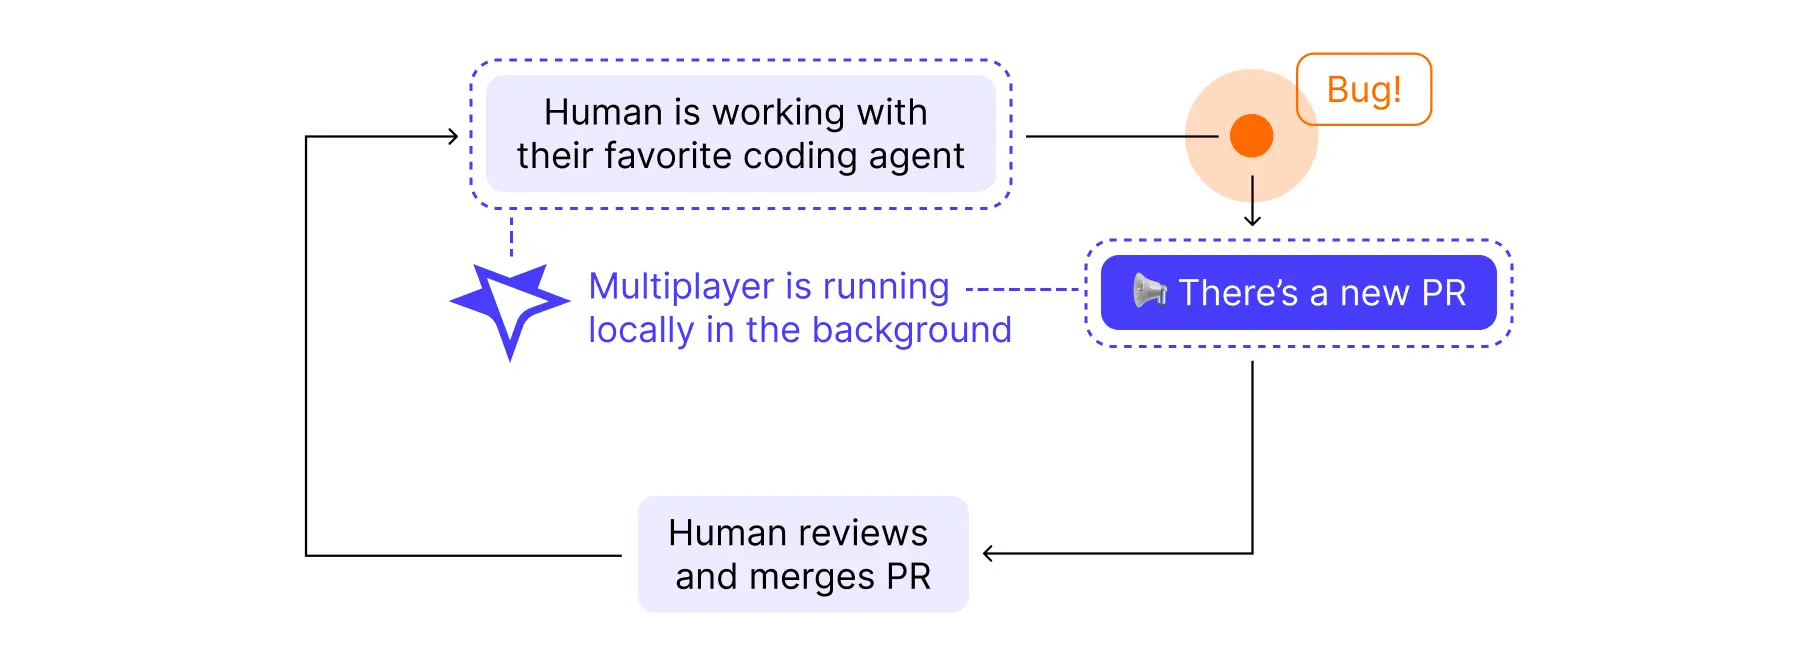
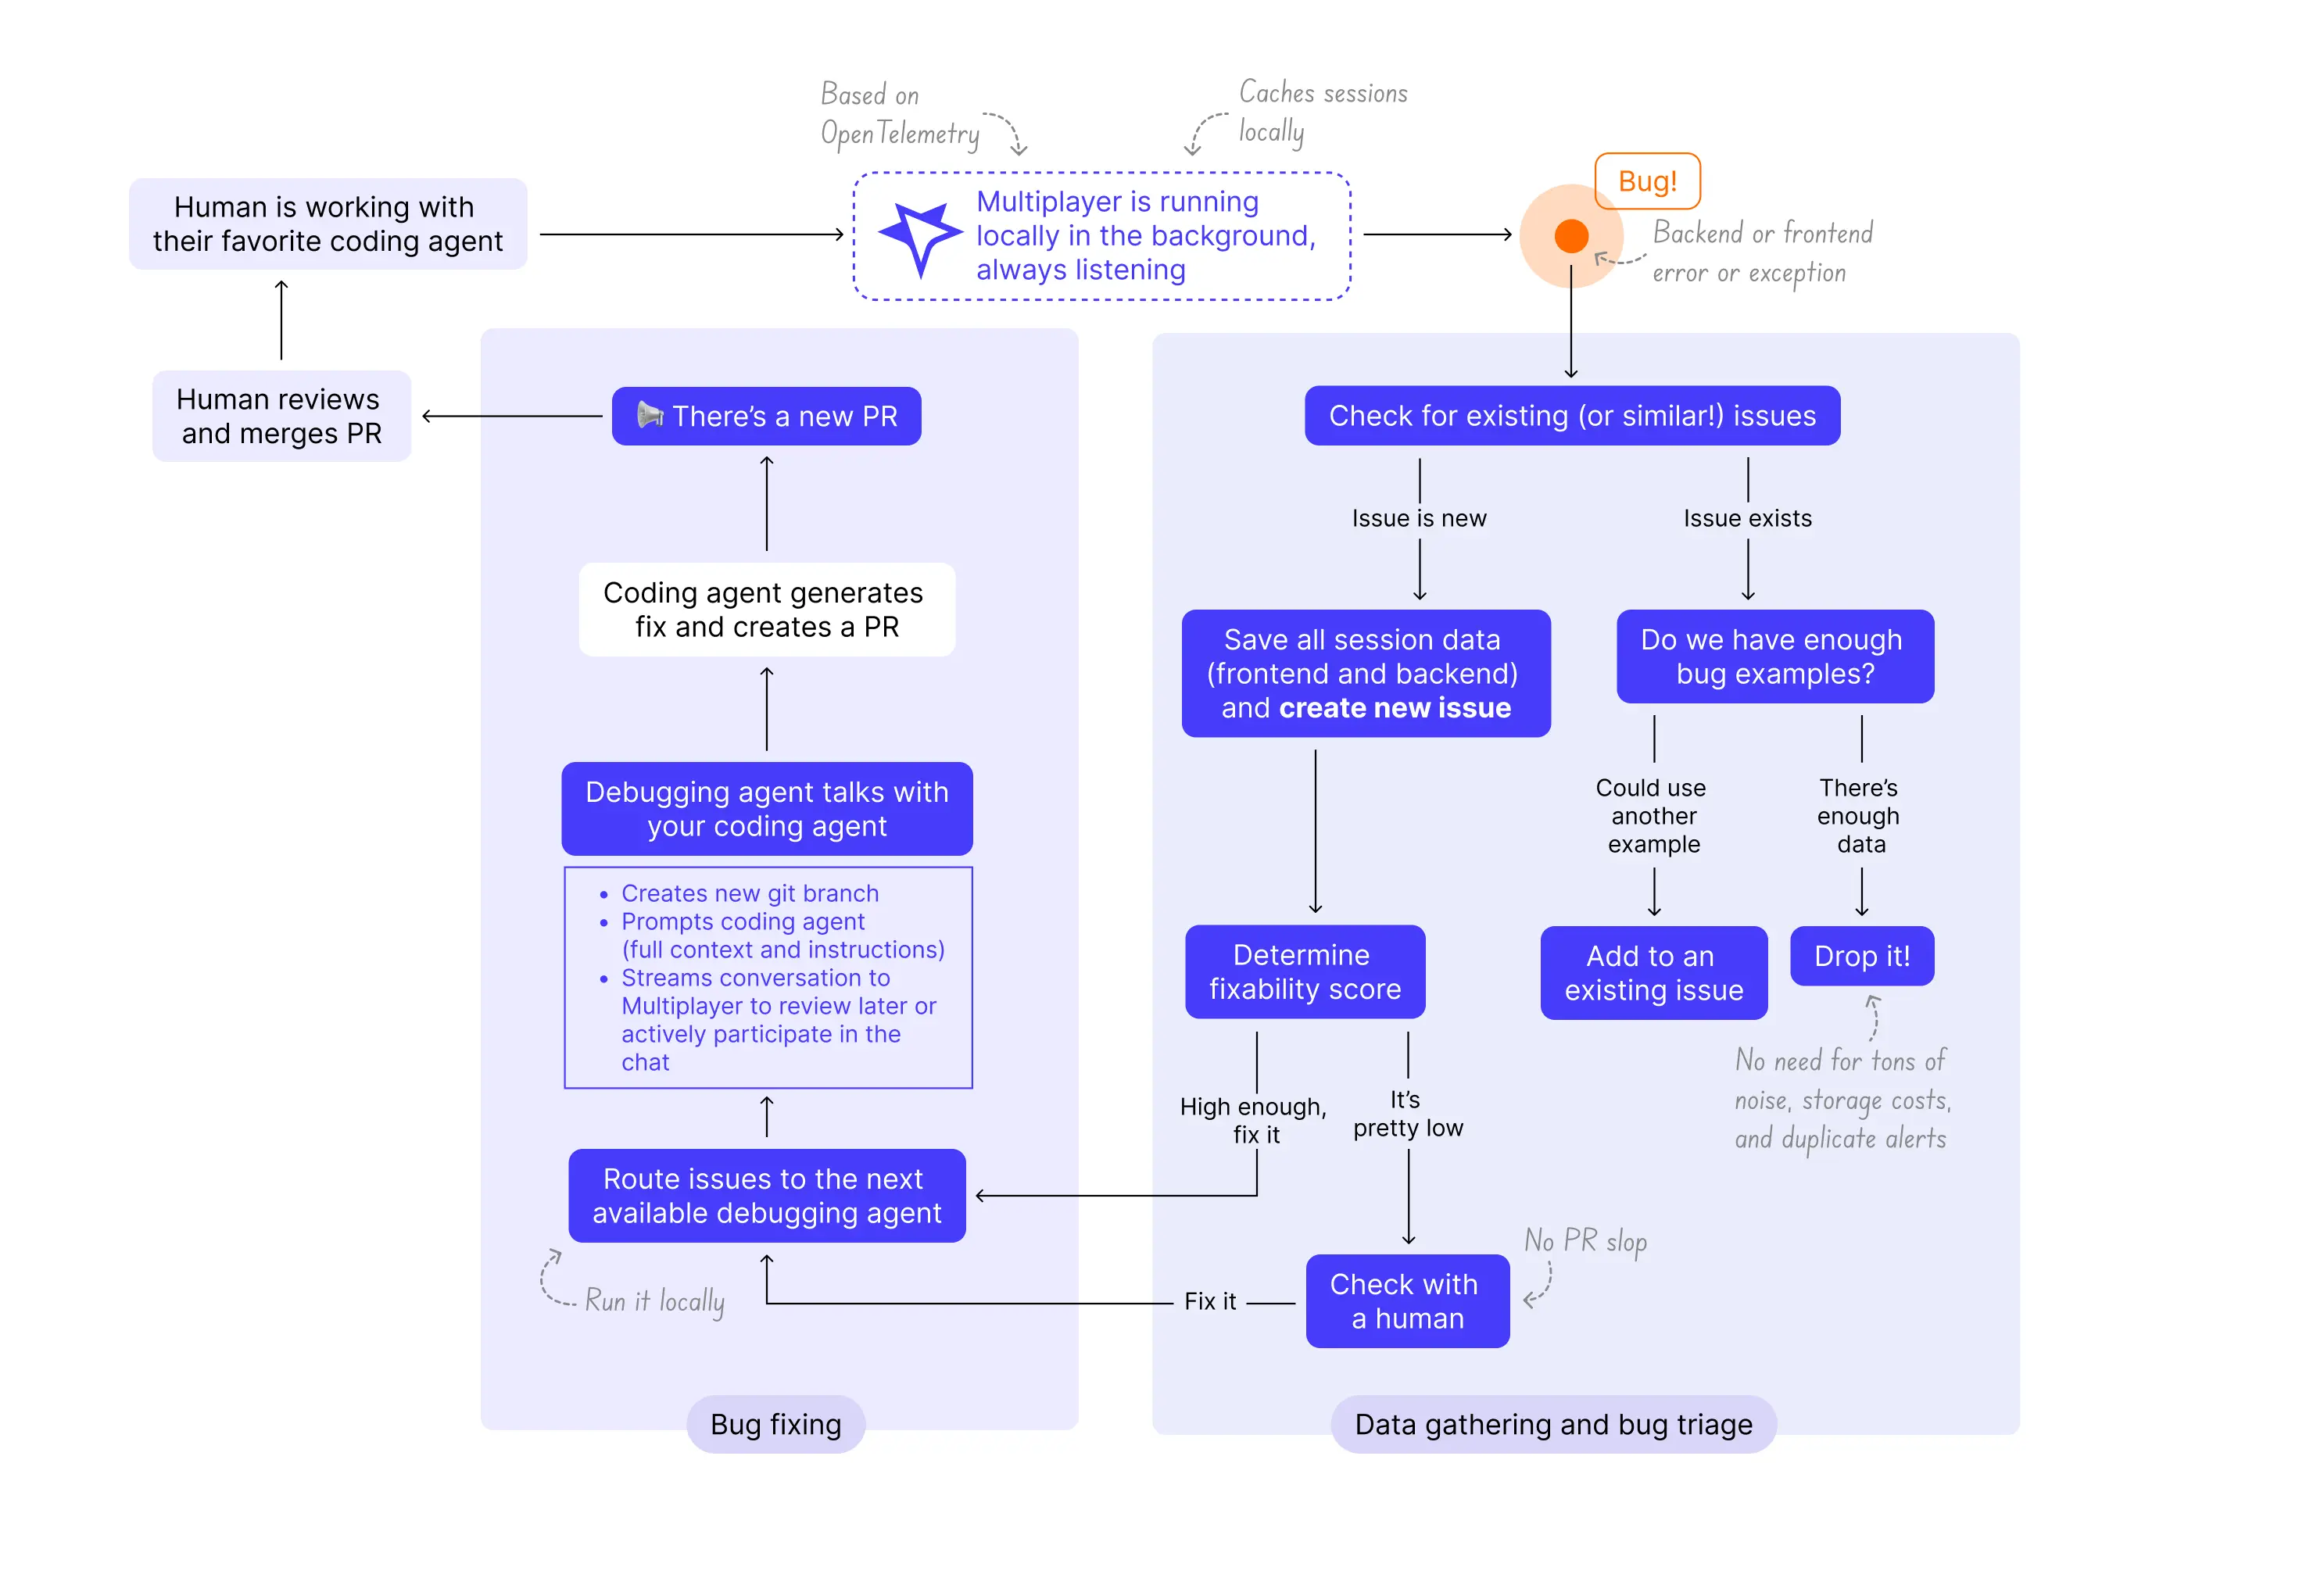
How Multiplayer fits into your workflow: