Guide
System Architecture Diagram: Tutorial & Examples
Table of Contents
A system architecture diagram visually represents a system's structure and organization, highlighting components, relationships, and data flows. A quality diagram can enhance the system architecture design process and build a shared understanding within a team.
This article will explore five essential best practices for creating and maintaining system architecture diagrams, with an emphasis on automation tools. By leveraging these tools and practices, teams can automate documentation updates and centralize system information, ensuring a single source of truth.
Summary of key system architecture best practices
The table below summarizes the five essential best practices for creating system architecture diagrams we will explore in this article.
| Best practice | Description |
|---|---|
| Understand the components of a system architecture diagram | Clearly understand and visually represent key components such as services, connections, interfaces, data flows, and external systems to ensure clarity and avoid ambiguity. |
| Use standard conventions | Employ consistent symbols and conventions to facilitate clear communication and understanding across different teams and stakeholders, reducing the risk of misinterpretation. |
| Visualize architectures with different types of diagrams | Utilize various diagram types (e.g., system architecture, sequence, and network diagrams) to capture different levels of abstraction and perspectives. This ensures comprehensive coverage of the architecture. |
| Use effective diagramming techniques | Apply hierarchy and layering for clarity, align and group related elements, use labels and annotations for context, employ color purposefully, and ensure adequate white space for readability. |
| Utilize automated tooling | Choose diagramming tools based on their ease of use, supported diagram types, automation features, version control, and integration with other tools. |
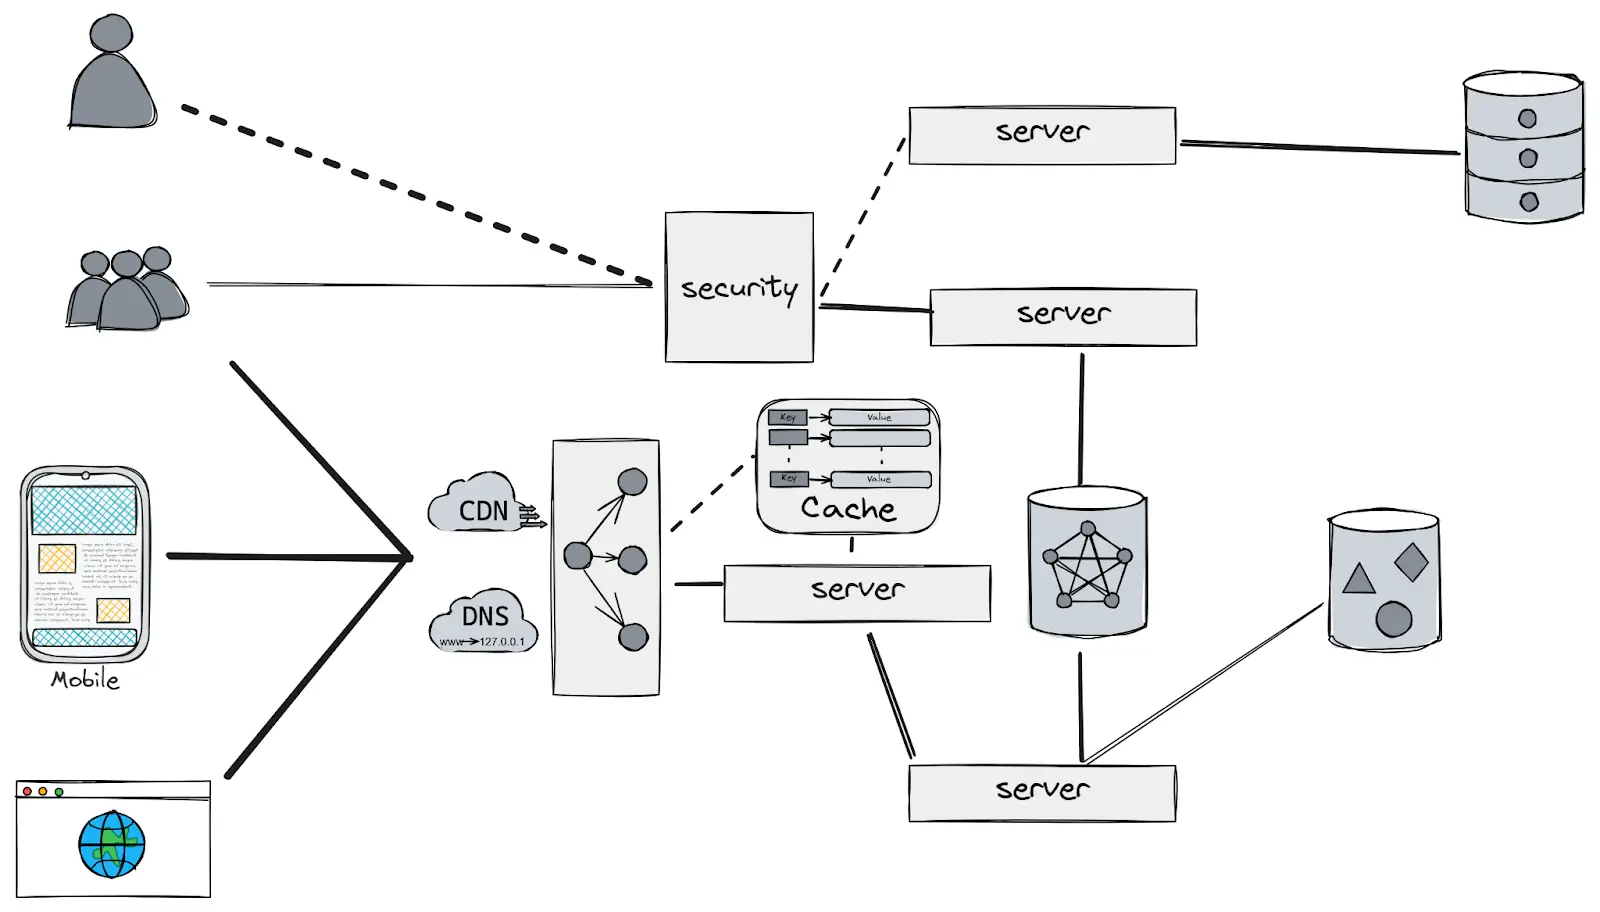
Understand the components of a system architecture diagram
The foundation of a system architecture diagram lies in a clear understanding of its core components. This section dives into key elements of a system architecture diagram and explores how to define and depict these elements to ensure system architecture diagrams convey information clearly and unambiguously.


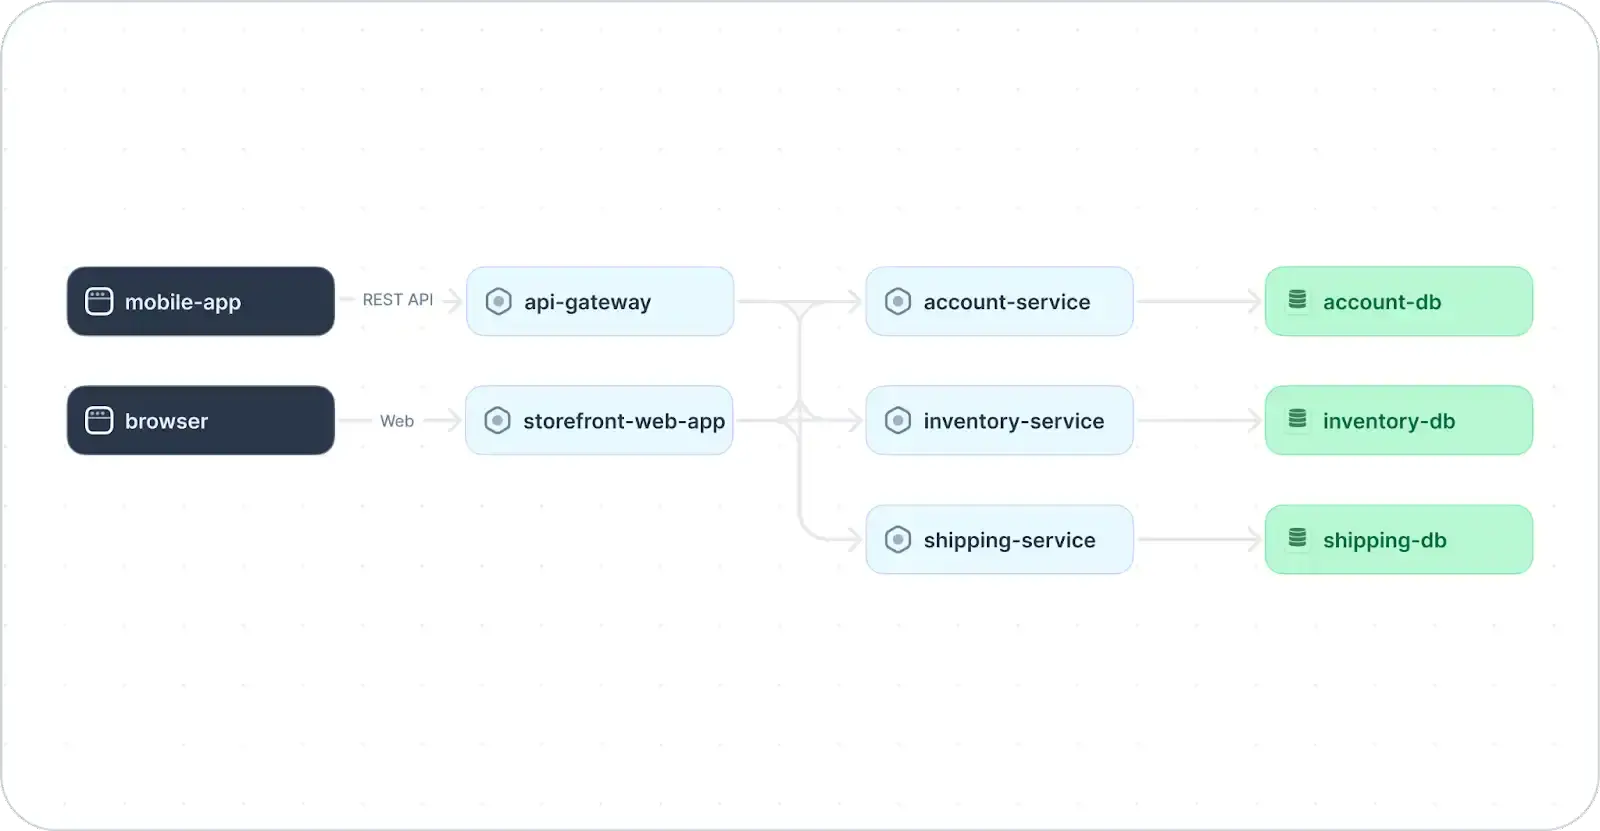
Example system architecture diagram (adapted from Source)
Key components of a system architecture diagram
A well-crafted system architecture diagram visually represents building blocks and interactions within a system. Below is a breakdown of the essential components.
| Component | Definition |
|---|---|
| Component | A self-contained unit of functionality within the system. Components can be individual services, applications, databases, or other logical groupings. |
| Connection | Represents the interaction or communication pathway between components. This can involve data transfer, control flow, or service invocation. |
| Interface | Defines the rules and protocols for communication between components. It specifies the methods, parameters, and data formats used for interaction. |
| Data flow | Illustrates the movement of data between components. Arrows typically depict the direction and nature of the data flow (e.g., read, write, or update). |
Importance of clarity in component representation
Clarity in component representation ensures the diagram effectively communicates the system's structure, promotes understanding, and empowers stakeholders to interact with and maintain the system more easily. Precise visual representation of components directly impacts the diagram's effectiveness in conveying information. Clarity in component representation also provides the following benefits:
- Enhanced understanding - Clear visuals help viewers to grasp the system's structure and functionality. Unambiguous representation ensures everyone interprets the diagram consistently, minimizing confusion and misinterpretations.
- Improved communication - A clear diagram is a powerful communication tool. By readily understanding component roles and interactions, stakeholders from both technical and non-technical backgrounds can effectively understand and discuss the system.
- Efficient troubleshooting - A clear diagram becomes a valuable asset when issues arise. Quickly identifying and understanding components and their relationships enables faster debugging and issue resolution.
- Effective onboarding - Clear component representation fosters smoother onboarding for new team members. A system architecture diagram serves as a visual roadmap, helping them grasp the system's architecture and how to work with it.
Use standard conventions
Consistent symbols and conventions are the backbone of clear system architecture diagrams. Adopting standard notation ensures everyone interprets the diagram accurately and quickly.
Benefits of standardization
Standardized notation in system architecture diagrams offers key advantages. First, it promotes clear communication across teams of diverse technical backgrounds. Everyone viewing the diagram can readily understand the meaning of symbols and conventions, reducing confusion and misinterpretations. This fosters smoother collaboration and knowledge sharing as everyone speaks the same visual language.
In addition, standard notation improves the efficiency of working with diagrams. Viewers do not need to spend time deciphering custom symbols or internal team conventions. They can quickly grasp the system's structure and focus on the relevant information.
Consistent use of symbols and conventions
System architecture diagrams rely heavily on visual elements to convey complex information. While there may be a temptation to create custom symbols or notations specific to your platform, this practice creates a steeper learning curve for those unfamiliar with your particular conventions.
Instead, we recommend consistently using established standards. This allows you to leverage the existing knowledge base of viewers, promoting clear communication across teams with diverse technical backgrounds. This consistency also reduces the learning curve for new team members and fosters efficient collaboration, ensuring everyone interprets the diagram accurately and quickly. Some examples of established standards for system architecture diagrams include:
- Using rectangles and boxes to show system components.
- Illustrating component connections, relationships, and data flow with lines or arrows.
- Using proximity and layering to group related elements.
- Adding annotations on interfaces, implementation, integrations, and other details.
By adhering to a recognized standard notation, system architects ensure their diagrams function as effective communication tools, enabling everyone involved to understand the system's structure and interactions readily.
Full-stack session recording
Learn more


Visualize architectures with different types of diagrams
Modern system architectures are sprawling and multifaceted, and a single diagram might not capture their entirety. To effectively communicate different aspects of such systems, consider employing different types of diagrams to communicate their architecture more comprehensively.
System architecture diagrams
Utilize system architecture diagrams to offer a high-level view of a system's design, focusing on the relationships and interactions between its major components. The system architecture diagram below shows the major components of a monolithic e-commerce platform.


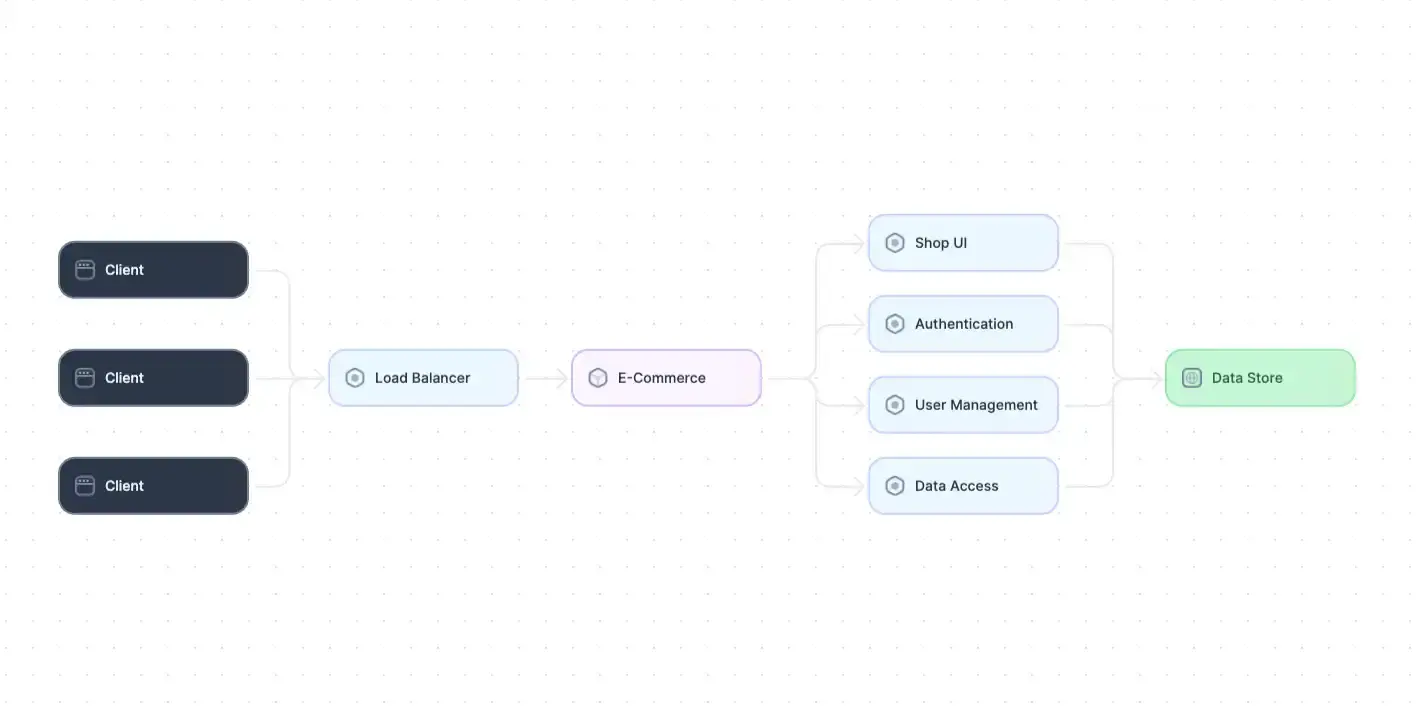
Example of a system architecture diagram (adapted from Source)
Sequence diagrams
Use sequence diagrams for a more specific look at system functionalities. These diagrams depict the interactions between services in responding to queries, handling user authentication and authorization, and delivering resources. The sequence diagram below shows the order placement process of an online store.


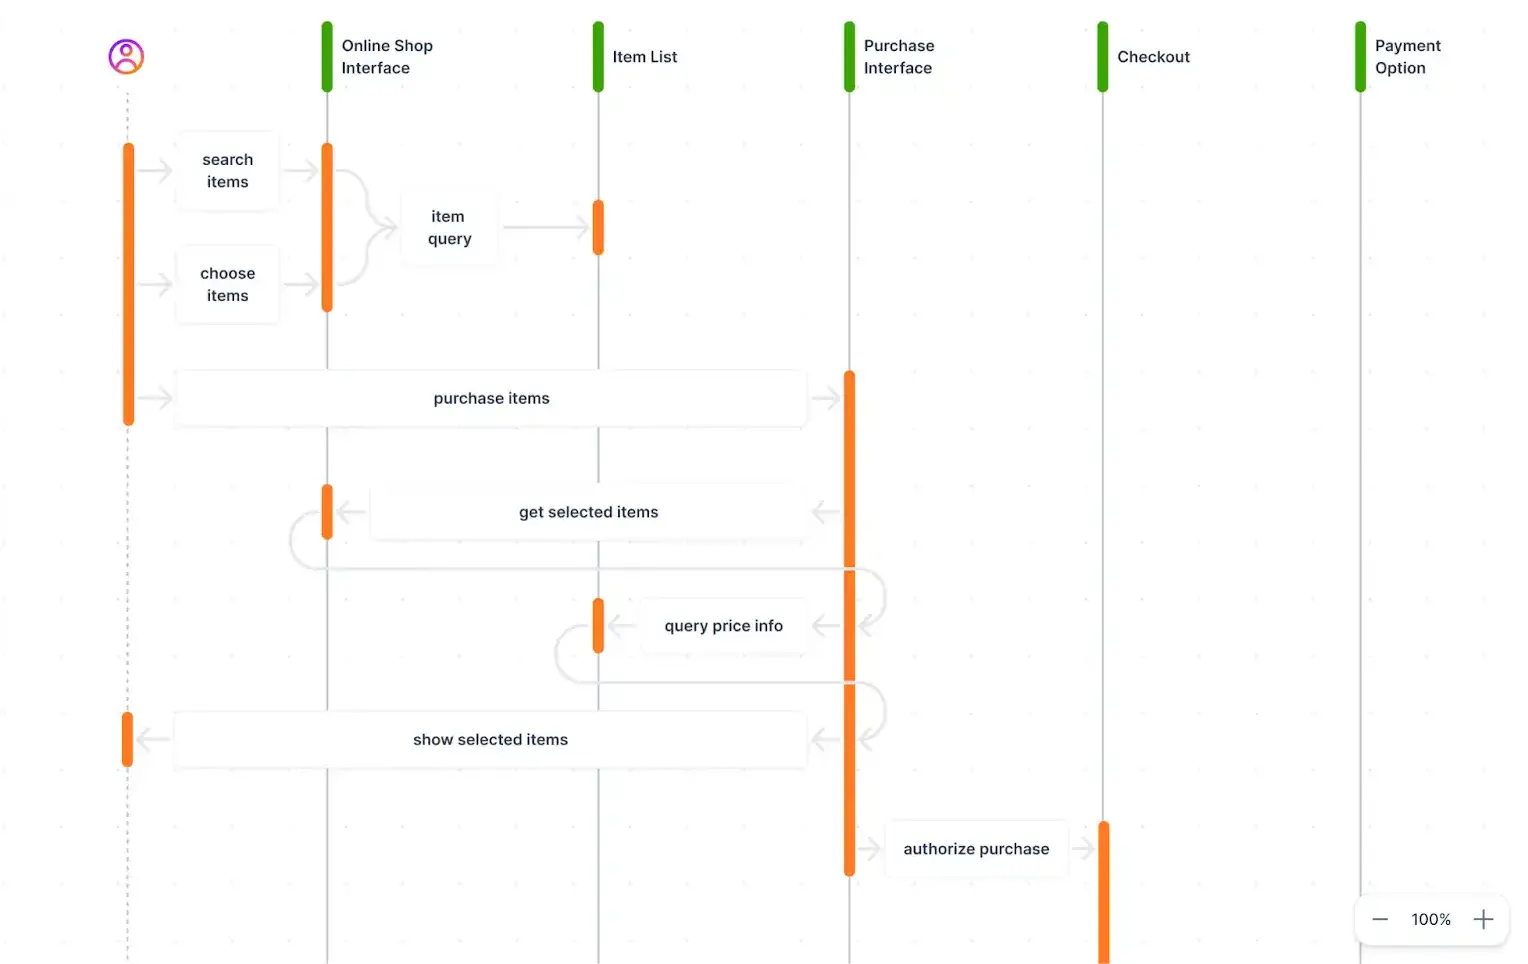
Example of a sequence diagram
Interact with full-stack session recordings to appreciate how they can help with debugging
EXPLORE THE SANDBOX(NO FORMS)
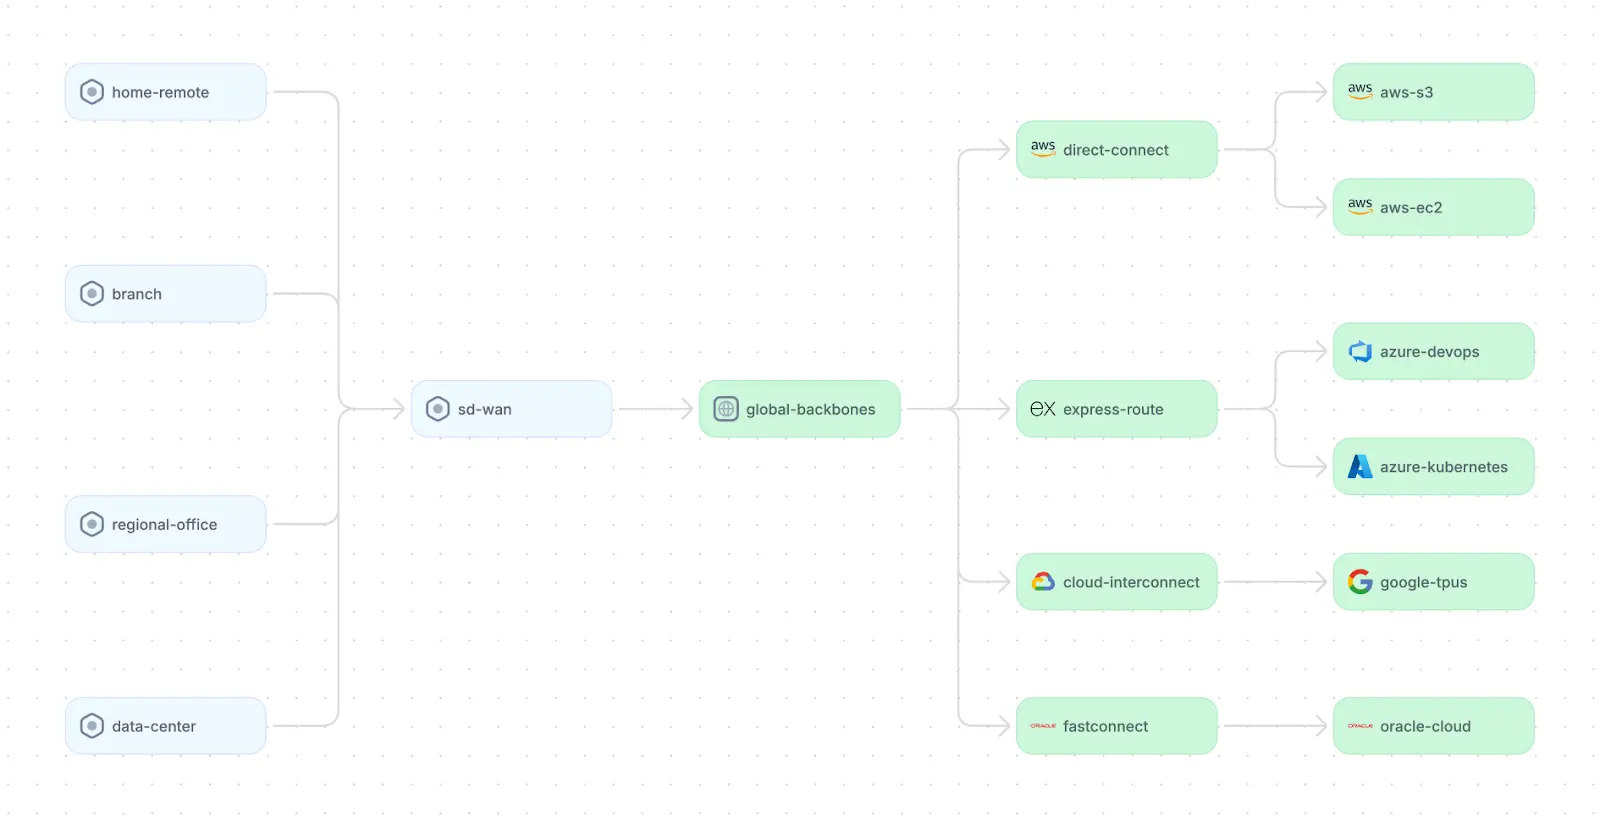
Network diagrams
Network diagrams help showcase a system's primary components from a networking perspective. They illustrate the logical relationships and interactions between elements like CDNs, API gateways, service registries, and container orchestration platforms. In addition, network diagrams can include IP addresses and physical locations of different computing resources.
The network diagram below shows the types of computing resources hosting each service and the relationships between the application’s internal API and third-party services.

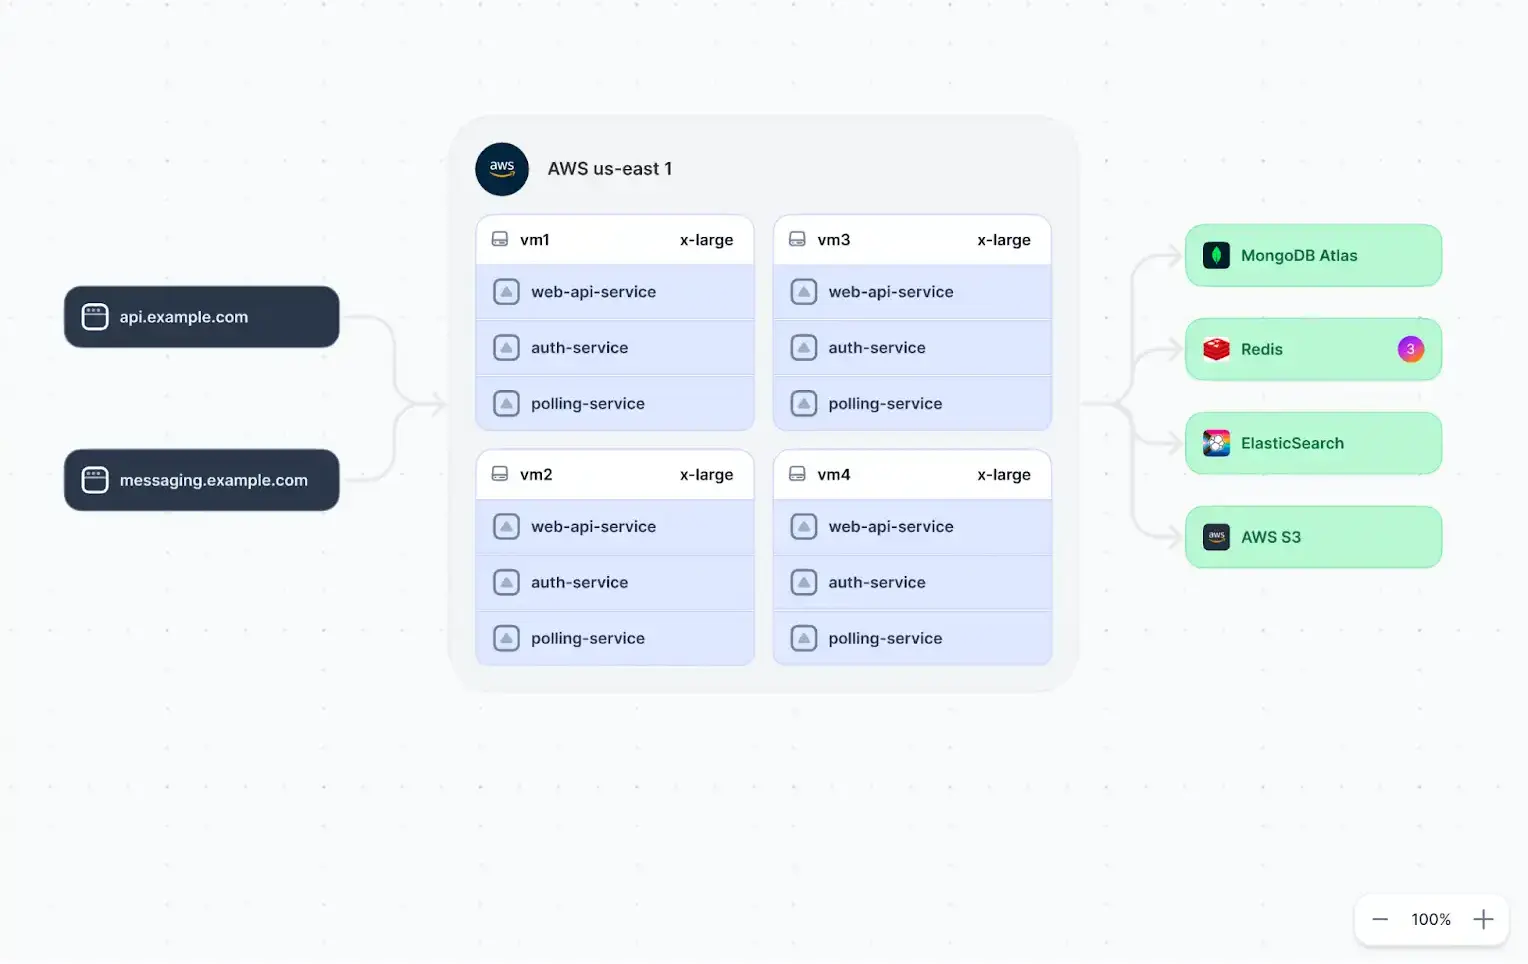
Example of a network diagram
Use effective diagramming techniques
Crafting clear and informative system architecture diagrams requires careful consideration of how elements are presented. Let’s explore a range of diagramming techniques that enhance clarity, organization, and overall understanding of the system's architecture.
Hierarchy and layering for clarity
Structure the diagrams logically, using a clear hierarchy and layering to distinguish different components, services, and subsystems. This helps viewers grasp the overall system organization and information flow.
Alignment and proximity for better organization
Position elements strategically to enhance understanding. Align related components vertically or horizontally, and group them based on functionality. Utilize proximity to visually indicate relationships between components – elements placed closer together are generally considered to have stronger interactions.
Interactivity and dynamic context
Static diagrams inevitably leave blind spots. Instead of relying on static, annotated diagrams and system information spread across multiple tools, select a single platform that allows you to embed live context directly into the diagram. For example, tools like Multiplayer allow you to add elements such as links to real-time telemetry, full-stack session recordings, source code, and API specs. Instead of guessing what a box represents, any team member can click through actual system components and see how that part of the system behaves in production.
Soliciting feedback and iterative improvement
System architecture diagrams should be living documents that evolve with the system. Regularly solicit feedback from stakeholders and team members with diverse technical backgrounds. Use this feedback to identify areas for improvement and refine your diagrams iteratively. This ensures your diagrams remain accurate, relevant, and a valuable communication tool for everyone involved.
Tailoring diagrams to the audience
Consider who will be viewing the diagram and what level of detail they require. A high-level overview for stakeholders might differ from a detailed technical breakdown for development teams. Adapt the information presented to best suit the audience's needs.
Utilize automated tooling
Automated diagram tools ease the overhead of creating and maintaining system architecture diagrams and allow diagrams to serve as a single source of truth for system knowledge and implementation details. When choosing a diagramming tool, consider the following criteria:
- Ease of use - An intuitive interface allows team members with varying technical skills to create and update diagrams efficiently.
- Automation - Automatic diagram updates based on changes in your system significantly reduce the time and effort required to maintain diagrams.
- Collaboration features - Real-time editing and commenting features enable smooth collaboration among team members working on the diagrams together.
- Version control - Tools that maintain a comprehensive history of changes to each diagram allow you to revert to previous versions or track the evolution of your system architecture.
- Review processes - Review processes within the tool enable feedback and approval cycles for each diagram.
- Integration with other development tools - Integration with code repositories, dependencies, and APIs helps ensure your diagrams always reflect current information, minimizing inconsistencies and errors.
Modern, collaborative tools like Multiplayer include all of the features above and empower teams to create interactive and information-rich diagrams that become a central hub for understanding, maintaining, and evolving complex systems. This is achieved through real-time updates from development and production environments, automatic population with metadata, and interactive elements.
System architecture diagram example
Now that we have explored best practices for crafting effective system architecture diagrams, let’s take a look at how to implement these strategies.
Consider the system architecture diagram below.


One click. Full-stack visibility. All the data you need correlated in one session
RECORD A SESSION FOR FREEAt first glance, the diagram shows a clean, high-level overview of a system. It uses proximity to show related elements and lines to show interactions between different components.
However, the diagram also contains several “diagramming anti-patterns.” For example, it contains elements with ambiguous or no names, does not effectively utilize color, and lacks annotation. Anyone unfamiliar with the symbols in this diagram would have difficulty identifying and differentiating between certain elements. Finally, there are no arrows to trace the direction of data flows.
More importantly, this diagram suffers from common problems inherent to static diagrams:
- It will not stay in sync with changes in code, APIs, or infrastructure unless someone updates it manually.
- Adding more labels and annotations could add more clarity, but the real implementation details are still scattered across repos, logs, and documents.
- A static image cannot show how requests actually move through your system or how components behave in production.
Multiplayer’s system dashboard and full-stack session recordings address these limitations. The system dashboard continuously discovers APIs, services, and dependencies from your running system, displays them in a list view alongside live telemetry, and auto-generates architecture diagrams. Because the tool integrates with OpenTelemetry, it captures detailed system information and automatically updates both the component list and architecture diagrams.


Architecture diagram created using Multiplayer
Within this view, users can access repositories, implementations, and documentation by clicking on individual components. From an operational perspective, engineers can utilize full-stack session recordings to observe real requests flowing from frontend interactions to backend services and databases. This makes it possible to trace the exact path of a request, understand how components interact, and pinpoint where issues occur in production.
Stop coaxing your copilot. Feed it correlated session data that’s enriched and AI-ready.
START FOR FREELast thoughts
System architecture diagrams are vital tools for building a shared understanding within teams and maintaining complex systems. By following the best practices outlined in this guide, teams can create clear, informative, and valuable diagrams that empower everyone involved. This allows system architecture diagrams to become powerful communication tools that foster collaboration, informed decision-making, and efficient system management.