
Your Software Changes in Real-Time, So Should Your Architecture Diagrams
The evolution of diagramming in software mirrors the evolution of software development: from static and planned upfront → to lightweight and iterative → to automated and real-time.
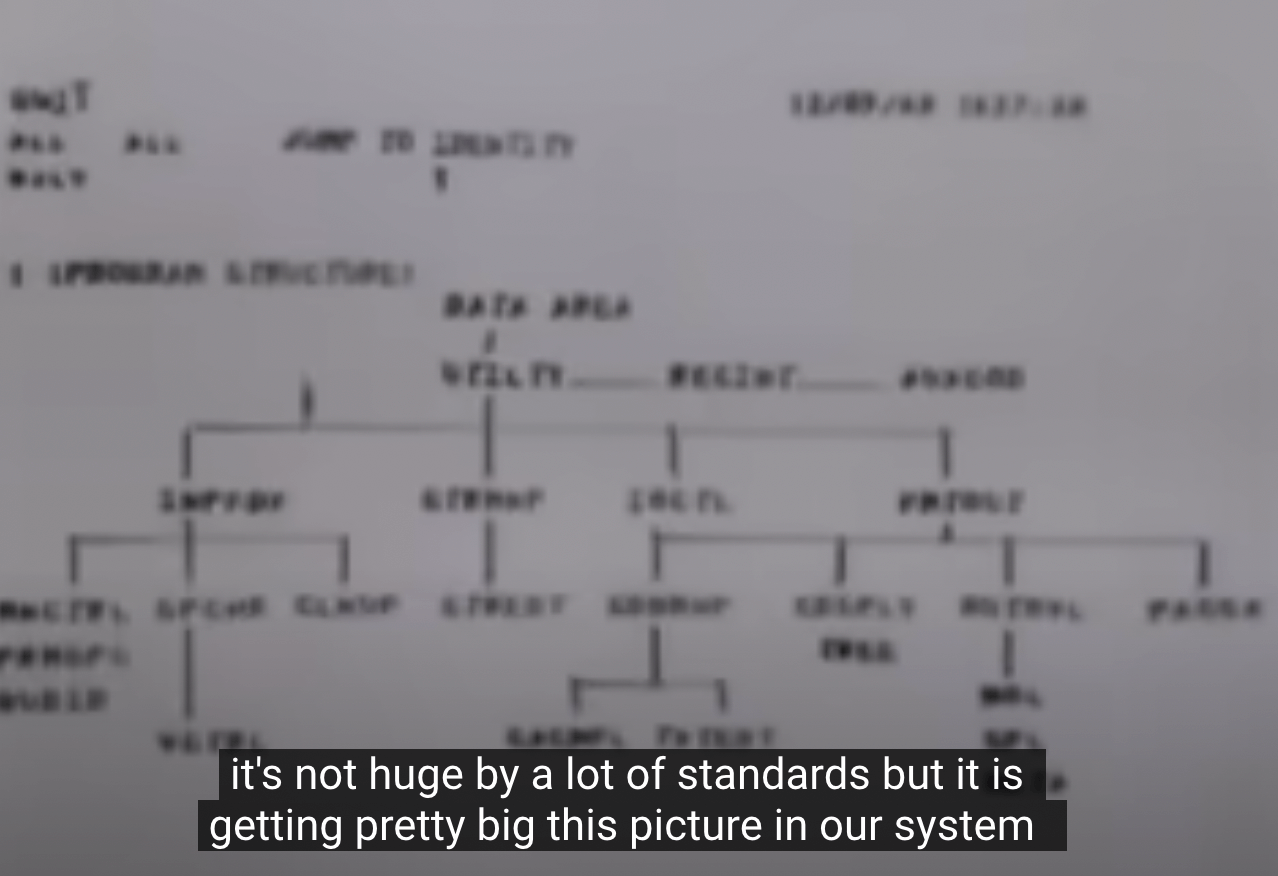
The 1968 “Mother of All Demos” by Douglas Engelbart wasn’t just a showcase of new technology—it was a glimpse into the future of how we interact with and visualize complex information, including software systems.
Engelbart’s groundbreaking presentation introduced graphical computing, interactive real-time collaboration, hypertext, and dynamic document editing—concepts that would later become fundamental to modern software development.
”…we’ve seen that [..] people can collaborate quite well over a period of time by working on joint files. In fact, you can have a join file and go leave a message and get a response in a matter of minutes because they are all available instantly…”
At the time, the idea that teams could edit and view shared knowledge structures simultaneously was revolutionary.
Today, it’s so deeply embedded in our tooling that we take it for granted. But this shift in how we interact with complex systems directly influenced how engineers design, document, and communicate software architectures.
From flowcharts and UML to diagram-as-code and observability-driven auto-documentation, we’ve moved closer to Engelbart’s vision of an interactive, dynamic, and collaborative way to understand and evolve complex systems.
Flowcharts
The earliest forms of software diagramming emerged alongside the rise of structured programming. Engineers needed a way to visualize control flow and break down complex processes into manageable steps before implementation.
This led to the adoption of Flowcharts for representing program logic and Data Flow Diagrams (DFD) for modeling how data moves through a system.
Flowcharts are one of the simplest yet most effective ways to visualize an algorithm before writing code. Their intuitive structure makes them a useful tool for breaking down logical sequences, decision points, and loops.

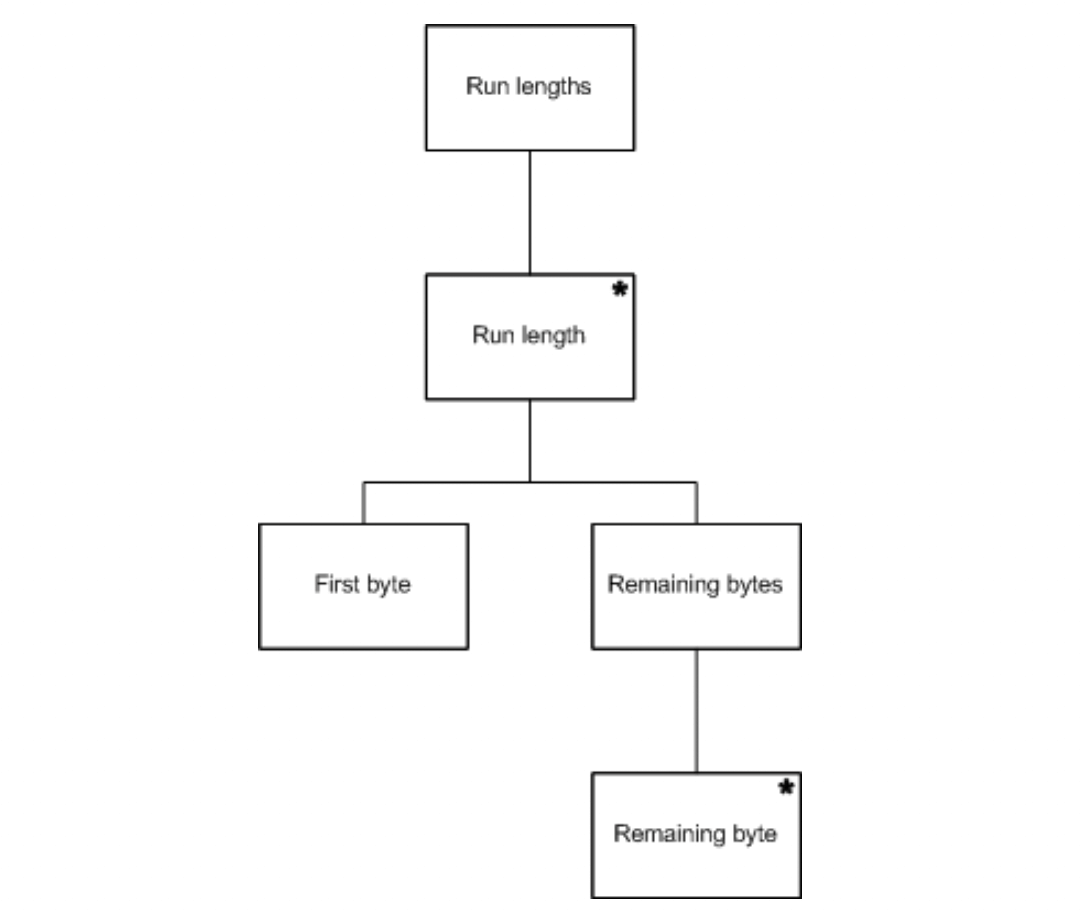
During this time, more structured visual methods emerged to support procedural programming, including Jackson Structured Programming (JSP) and Warnier-Orr diagrams.
However, these early diagramming techniques were primarily concerned with procedural flow and data movement rather than large-scale system design.
UML 2.5
As software became increasingly strategic for businesses, companies sought ways to automate development, improve quality, and reduce time-to-market. To manage growing complexity, the industry turned to component-based architectures, visual programming, patterns, and frameworks.
At the same time, software architects faced recurring challenges such as:
- Physical distribution of systems
- Concurrency and replication
- Security and fault tolerance
- Load balancing and scalability
The rise of web-based applications exacerbated these architectural concerns, driving demand for a standardized way to design, document, and communicate software architecture.
In response, the Unified Modeling Language (UML) was developed in the mid-1990s as a unified notation for software design. It combined and standardized multiple diagramming approaches into a single framework to:
✔️ Specify and visualize software systems
✔️ Construct and document software artifacts
✔️ Support business modeling and non-software systems
UML was created by James Rumbaugh, Grady Booch, and Ivar Jacobson, incorporating best practices from various object-oriented modeling approaches.
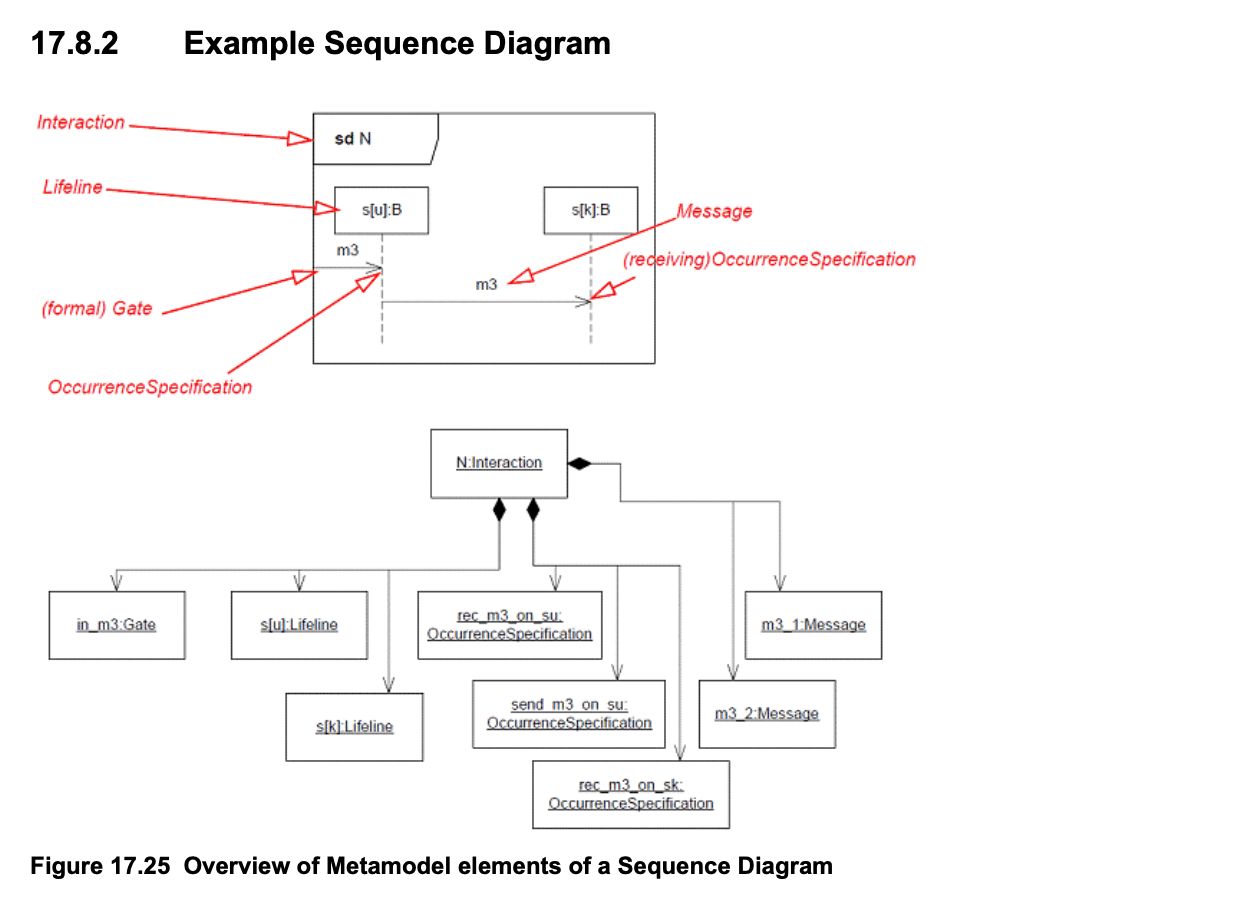
UML introduced 14 different types of diagrams to represent various aspects of software architecture (class diagrams, sequence diagrams, component diagrams, etc.).
While many UML diagrams have been adapted into other frameworks and tools, sequence diagrams remain particularly valuable to software developers.
Even though manually creating and maintaining sequence diagrams for complex systems can be difficult, they are still widely used to understand how different components interact over time in specific use cases.
It’s important to note that UML is a modeling standard, not a tool itself. Many tools have been developed to support UML-based modeling (e.g. PlantUML)
Over time, other architecture modeling frameworks have emerged, each offering different levels of abstraction and focus:
- C4 Model: Breaks down architecture into Context, Containers, Components, and Code to provide incremental levels of detail
- ArchiMate: An open enterprise architecture standard, offering structured visualizations for business, application, and technology layers
Drag and Drop Whiteboards
UML was designed as a formal modeling language, but its rigid structure often introduced too much overhead for agile teams that preferred lightweight, iterative documentation.
As software development moved toward continuous evolution, UML’s strict modeling approach became less practical for teams embracing DevOps, microservices, and rapid deployment cycles, where architectures change frequently.
With the Agile Manifesto (2001) the industry moved away from heavy documentation upfront and towards iterative development (although there’s a whole conversation to be had if we over-corrected and took the Agile manifesto too far).
The shift of developers prioritizing “working software over comprehensive documentation” led to a domino effect:
- UML lost popularity as teams moved away from heavyweight modeling
- Teams started using lightweight CRC (Class-Responsibility-Collaboration) cards, informal sketches, and ad-hoc whiteboarding
- Digital whiteboarding tools (e.g. Visio, LucidChart, Draw.io) became the go-to method for system design discussions
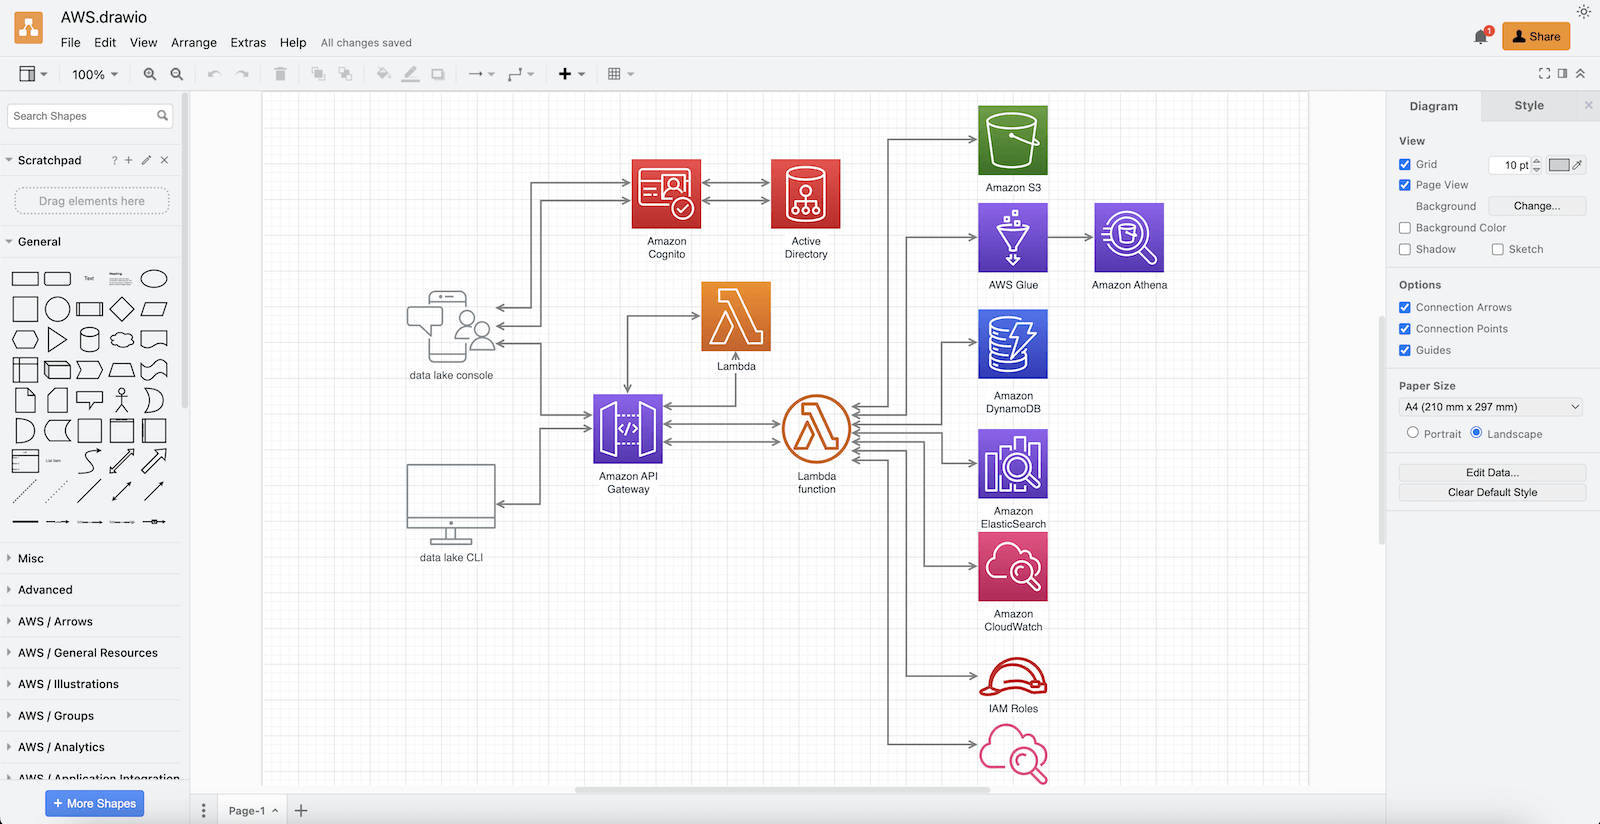
Diagram as Code
In the early days of cloud adoption, infrastructure was relatively simple. Teams could manually sketch out cloud architectures using basic tools, relying on static diagrams to represent their infrastructure at a single point in time.
But as cloud-native architectures grew more complex—introducing containers, distributed systems, and dynamic scaling—static diagrams quickly became outdated and failed to capture the real-time state of modern applications.
Many teams still use drag-and-drop whiteboarding tools to brainstorm and align on high-level architecture. However, these tools come with significant limitations:
❌ No version control – Difficult to track changes over time
❌ Manual effort – Requires constant updates as architecture evolves
❌ Lack of live data – Static diagrams quickly become outdated in dynamic systems
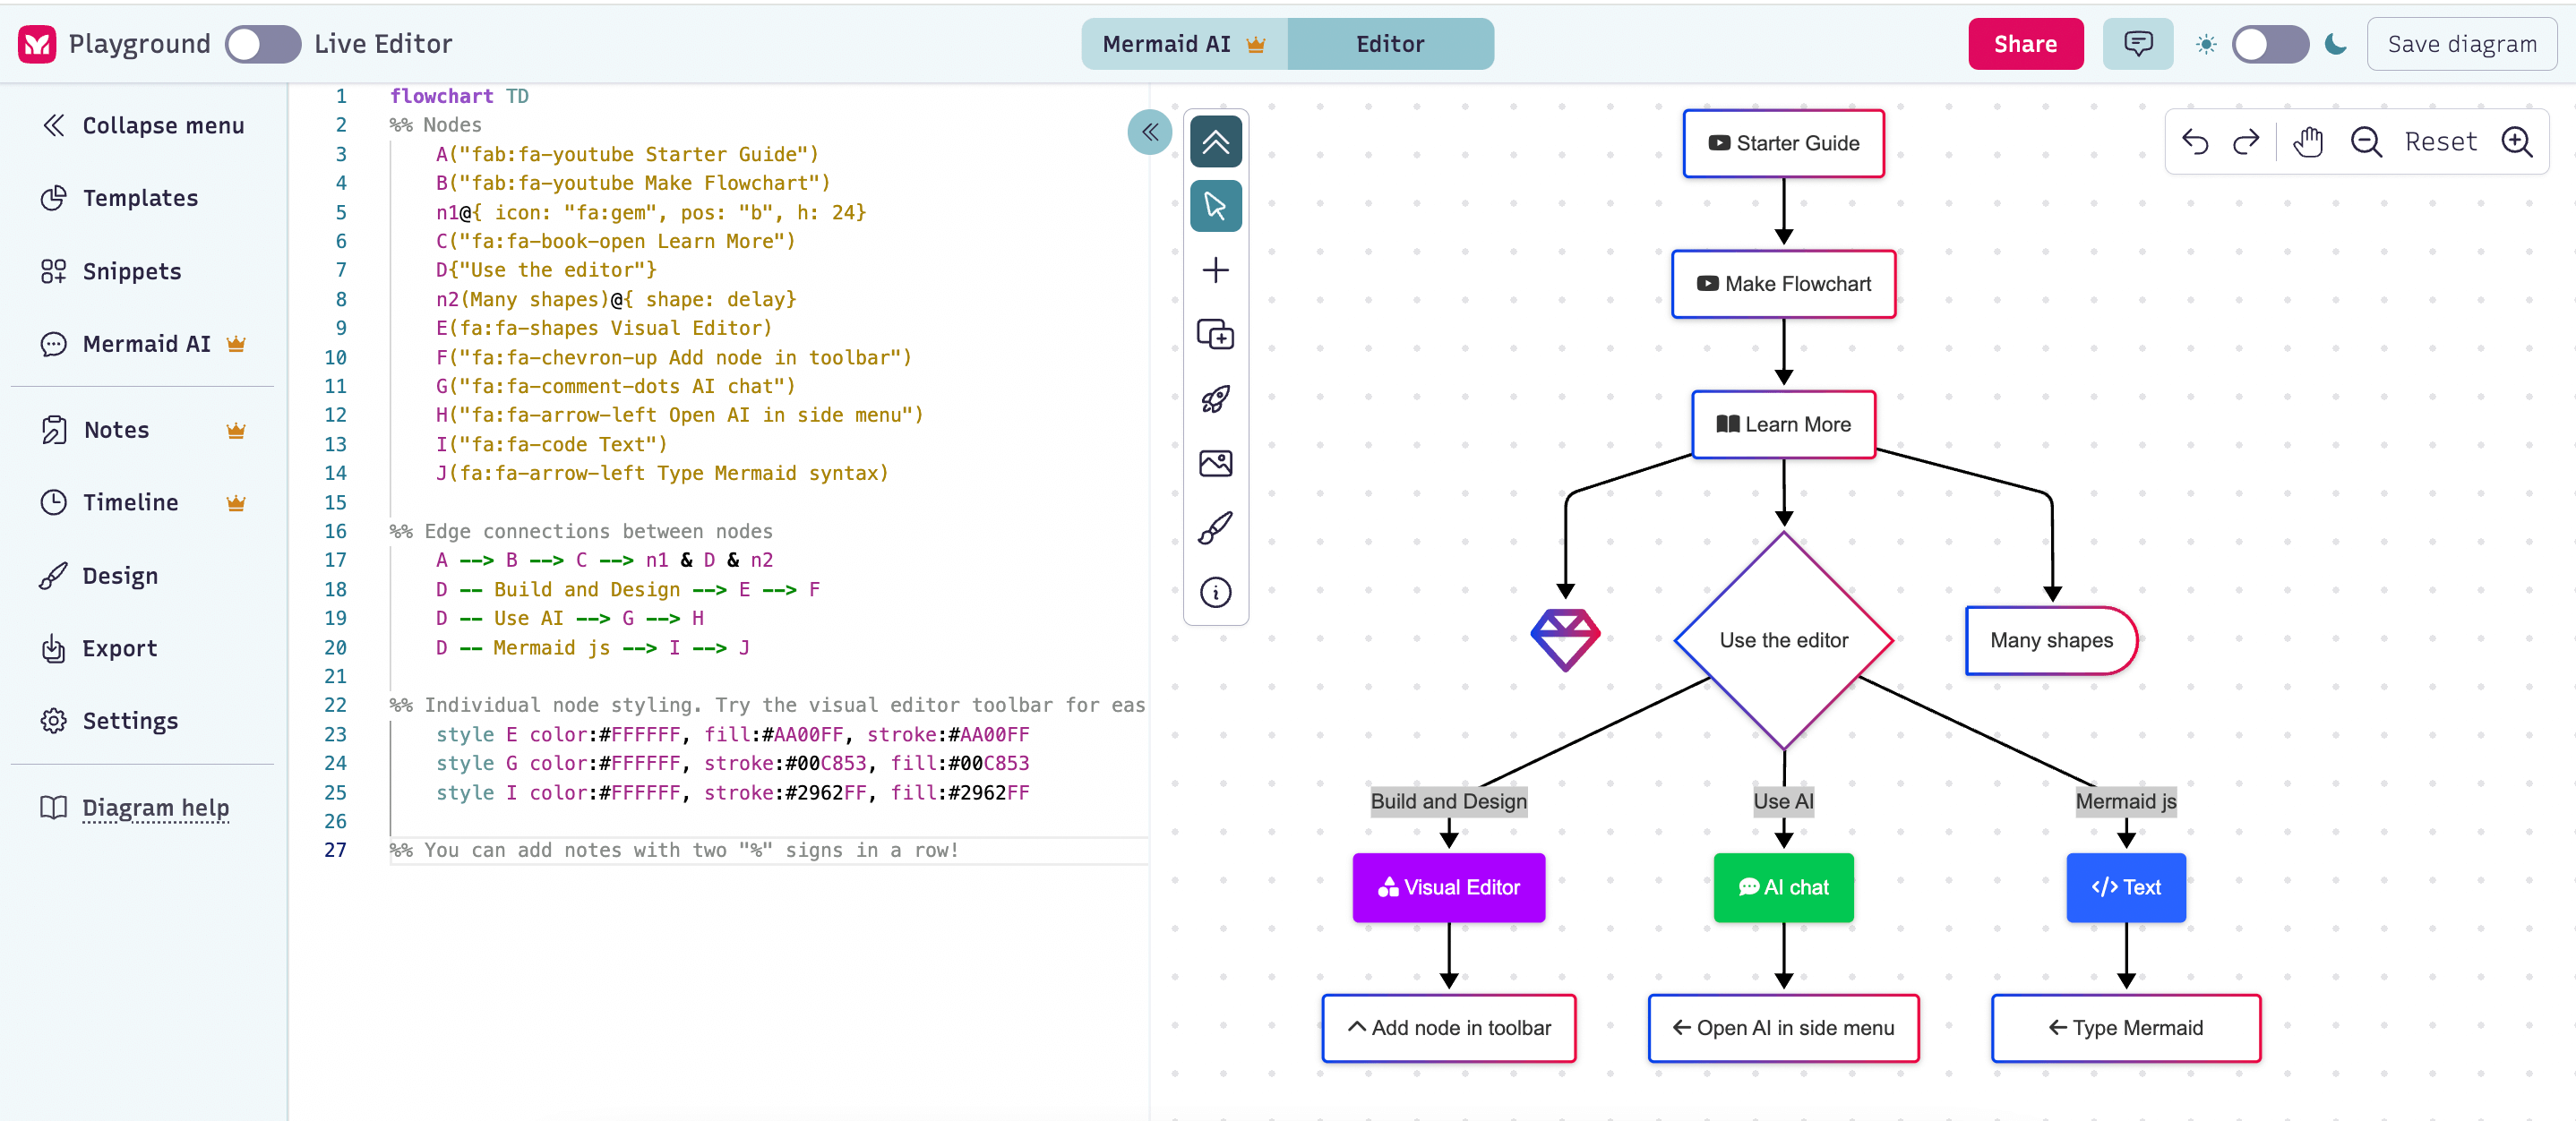
Because of the complexity of software architectures and the limitations of drag and drop tools, diagram-as-code (e.g. PlantUML, Mermaid.js, Diagrams, etc.) tools have recently become popular because they allow developers to create architecture diagrams programmatically — removing the overhead of manually generating the diagram and allowing better version control.
OTel Powered System Design
Diagram-as-code improved versioning and automated diagram generation, but it still required manual updates as systems evolved.
With the rise of distributed architectures, microservices, and dynamic cloud environments, software systems are becoming too complex to manage with static diagrams. Manual updates are not just inefficient—they're impossible to keep up with at scale.
The next step in the evolution of system visualization is observability-driven architecture diagrams, powered by OpenTelemetry (OTel) and real-time data.
Instead of relying on manually maintained snapshots, these tools (e.g. Multiplayer) provide live, continuously updated system views by connecting directly to the actual, running software.
Conclusion
In my opinion the move from static architecture diagrams (from paper flowcharts to diagram-as-code) to live system visualizations (Multiplayer, OpenTelemetry powered tools) is a direct application of Engelbart’s vision: the idea that we should offload cognitive complexity to visual collaboration tools, making it easier to reason and work on complex systems.
The evolution of diagramming in software also mirrors the evolution of software development itself and how best practices have evolved and layer on top of each other: from static and planned upfront → to lightweight and iterative → to automated and real-time.
Today’s best developer-focused tools don’t just diagram systems—they connect to them. They transform architecture diagrams from static snapshots into continuously evolving, interactive assets, bridging the gap between design and reality.
The next step is inevitable: AI-driven architecture tooling. Soon, we’ll see platforms that not only visualize a system but also predict infrastructure risks, detect architectural drift before it becomes a problem, and suggest optimizations based on best practices.
Software architecture is no longer just about drawing diagrams—it’s about creating living, breathing models of real-world systems.