Debugging with full stack session recording: turn up the signal, decrease the noise
Today we introduce the Multiplayer full stack session recordings: share replays that include relevant data from frontend screens to deep platform traces, metrics and logs so teams no longer have to search through unrelated data to find and fix bugs.
Debugging is a necessary but often tedious task for engineering teams. Developers are forced to manually reproduce issues and waste time and energy hunting for relevant data within the myriad logs, metrics and traces they receive. They don’t have a single tool that provides all of the data they need, across the entire software, including the backend.
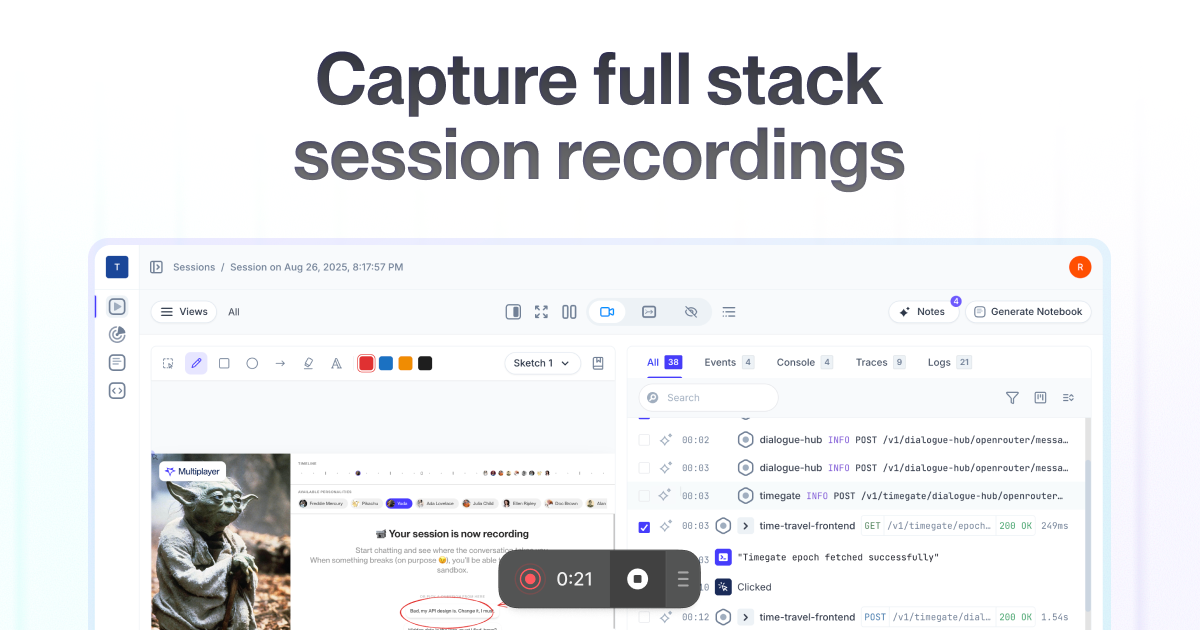
With Multiplayer full stack session recordings you can now record a full stack session replays of an issue and review all the relevant frontend and backend data in a single workspace. User actions, frontend screens, console errors, correlated to backend traces, logs, request/response content and headers.
Your team can quickly triage and debug issues with a full picture of the problem, without the guesswork of trying to figure out what’s happening in the backend or the headache of sifting through irrelevant data.
The problems with current debugging approaches
In conversations with engineering teams, three major issues with current debugging methods consistently stand out:
The first challenge is visibility.
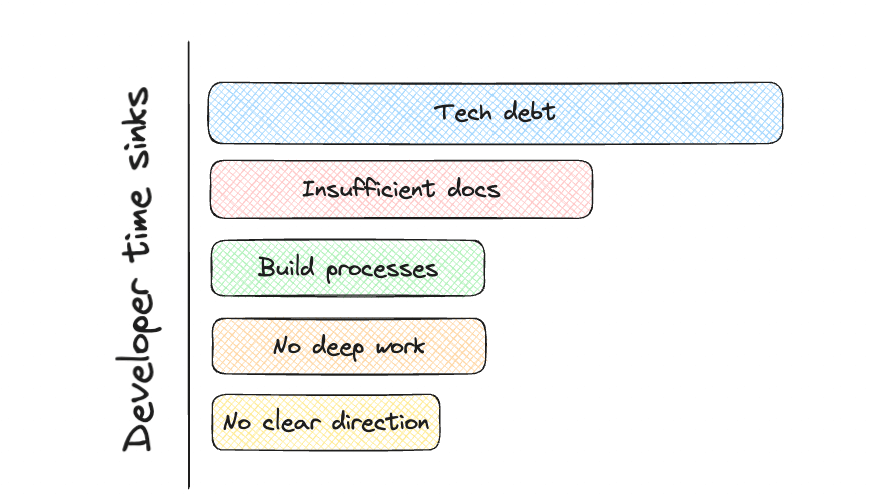
Many organizations, particularly those with legacy systems and technical debt, lack full visibility into their system. Without a clear, real-time view of all components, dependencies, and integrations, debugging feels like an archaeological dig: painstakingly uncovering and understanding the system layer by layer, before pinpointing the root cause of the problem.
The second challenge is the overwhelming amount of manual work.
When an issue arises, the typical debugging process involves:
- Reproducing the issue based on vague, incomplete reports (if any steps are provided at all).
- Sifting through APM data, searching through endless logs and traces, discarding irrelevant information to focus on specific errors, exceptions, and warnings.
- Navigating across scattered resources: dashboards, browser tabs, wikis, diagrams, APIs, repos. All to just to piece together the context around an issue.
The third challenge is inadequate tooling.
Modern software systems are increasingly complex, with interdependent internal and external services. Current debugging approaches provide an incomplete view of the problem because they only focus on a portion of the tech stack.
They either focus on frontend events, code introspection, or performance and system-health at scale. In short, they rarely show you what’s happening between the browser and the backend, continuing to treat parts of your system as a “black box.”
In summary, current debugging practices are bogged down by this missing information, excessive manual effort, and unnecessary context-switching.
The cost of inefficient debugging
The cost of relying on outdated debugging methods is far greater than it may seem at first glance.
A quick calculation reveals the substantial impact on both team capacity and budget:
◆ According to a recent Atlassian survey, developers are losing 8+ hours a week due to inefficiencies.
◆ The average salary (globally) for a backend developer is $67,227.
This means organizations spend roughly $13,445 per developer per year on inefficiencies.
For a team of 10, that’s the equivalent of having two full-time developers focused purely on inefficiencies. For SMBs and startups, where speed to market is critical, this is a significant waste of resources.
At larger companies with teams of 400 engineers, these costs can balloon to $5M annually.
But beyond the financial toll, there’s an equally crucial factor to consider: Developer Experience (DX). DX impacts how engineers perceive their work, directly influencing productivity, engagement, happiness and retention.
Inaccurate, manual, and scattered information combined with ineffective tools and workflows, has a direct effect on DX, ultimately hindering teams' ability to deliver reliable, scalable, and maintainable software.
How Multiplayer changes debugging
The Multiplayer full stack session recordings leverage our versatile frontend recording options with our comprehensive understanding of your entire backend system, ensuring that each session includes all relevant data: from frontend screens to deep platform traces, metrics, and logs.
Your engineering teams can quickly troubleshoot issues: support teams have immediate visibility, engineering teams have all the context and end-users have fast ticket resolution.
Your team can expect these benefits:
- Reduced inefficiencies: Multiplayer captures the steps to reproduce an issue, along with relevant full stack data, all in one click. No more grepping through logs, hunting through session replays, or reviewing scattered docs.
- Faster cross-team alignment: Engineers, support and end-users can simply share a session link that includes all the relevant information instead of writing long tickets or having to clarify issues through endless back-and-forth communication.
- Uninterrupted deep work: Context switching is minimized, allowing engineers to access a single source of truth for all system information, freeing them to focus on meaningful, productive work.
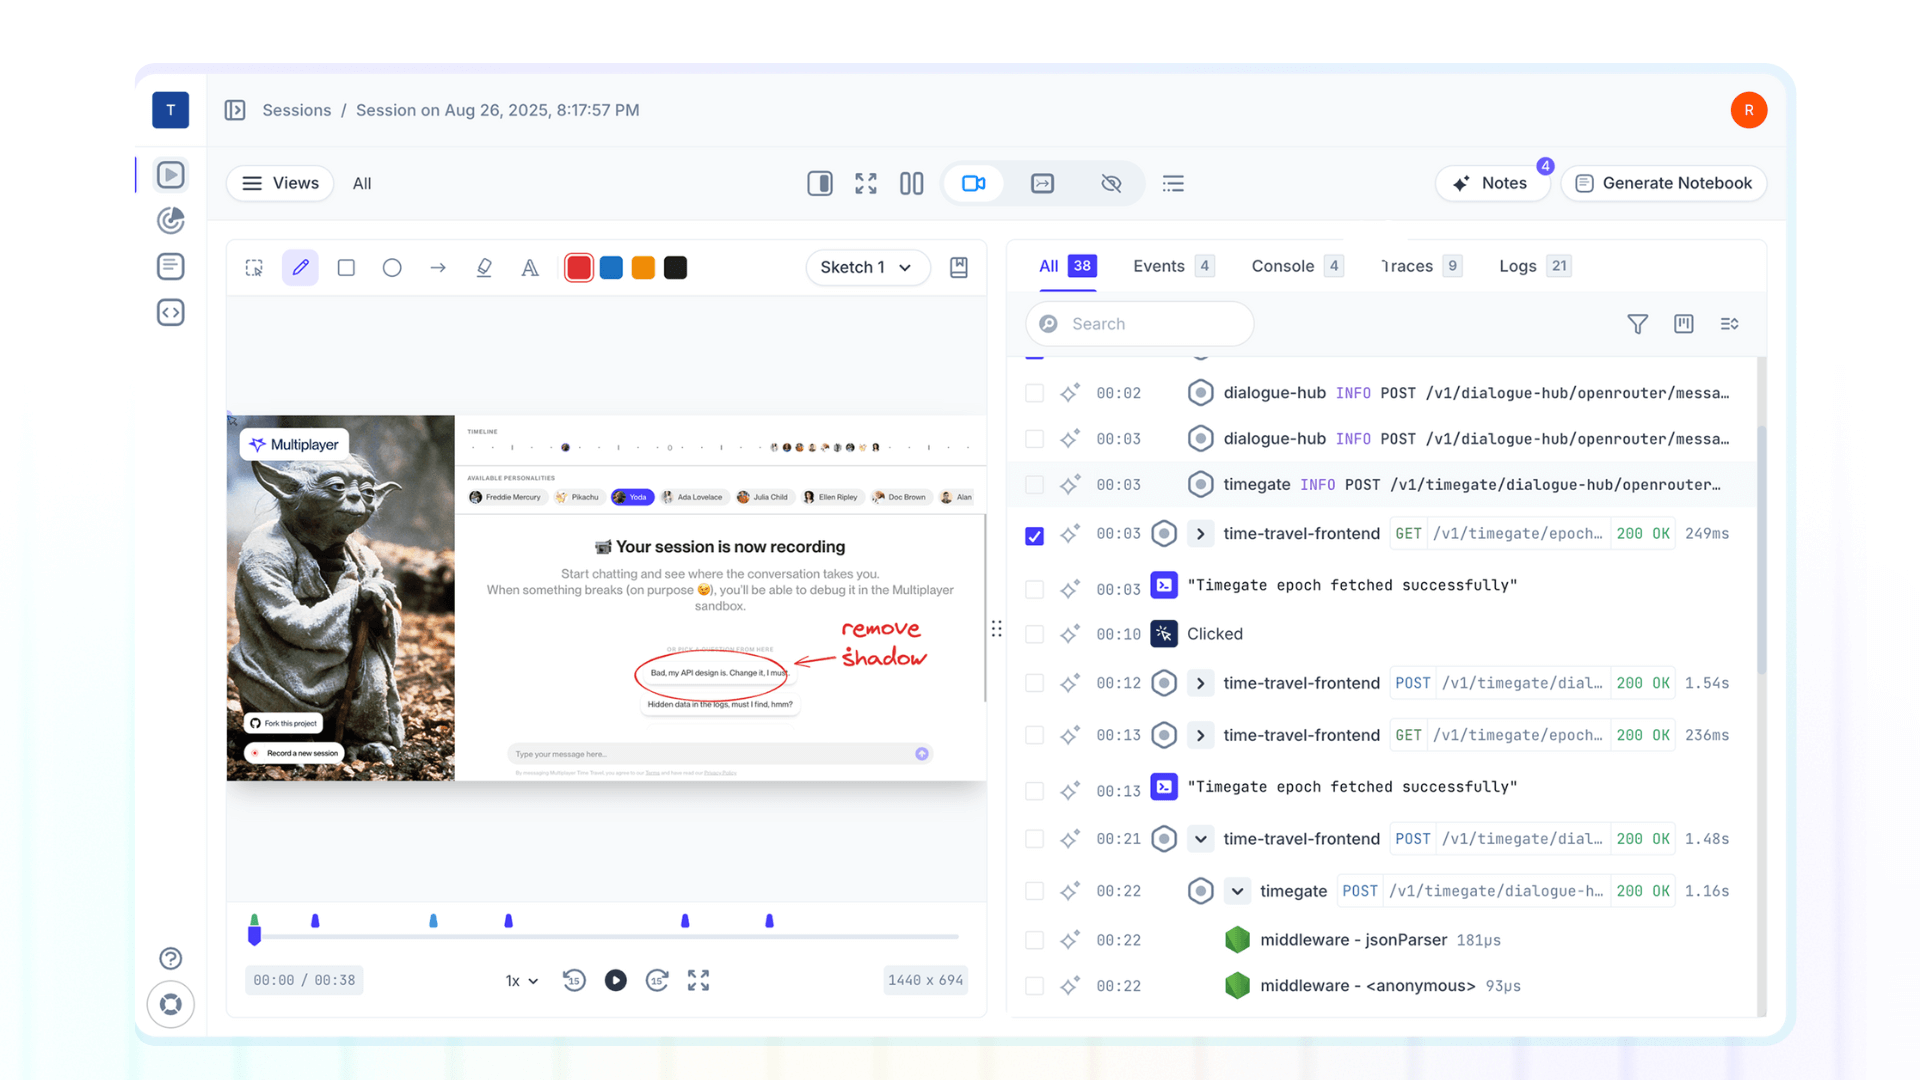
Full stack session recordings not only boosts developer productivity and experience but also transforms your end-user support interactions.
Instead of lengthy email exchanges with attached screenshots and descriptions, your users can install the Multiplayer Full stack session recordings and share a complete overview of their technical issues directly with your team.
👀 If this is the first time you’ve heard about Multiplayer, you may want to see full stack session recordings in action. You can do that in our free sandbox: sandbox.multiplayer.app
If you’re ready to trial Multiplayer you can start a free plan at any time 👇


